CTV-SVU01B-EN • Tracer AdaptiView Display Operations Guide 29
Data Graphs
• 8-hour graph with 2 hours between time labels
• 1-day graph with 6 hours between time labels
• 2-day graph with 12 hours between time labels
To change the scale, touch the plus or minus button in the magnifying glass in the lower
left corner of a data graph that you want to edit (see Figure 12, p. 28 as an example). The
slider scale moves to the right or left as you touch either the plus or minus button. The
time scale for the X-axis changes in response.
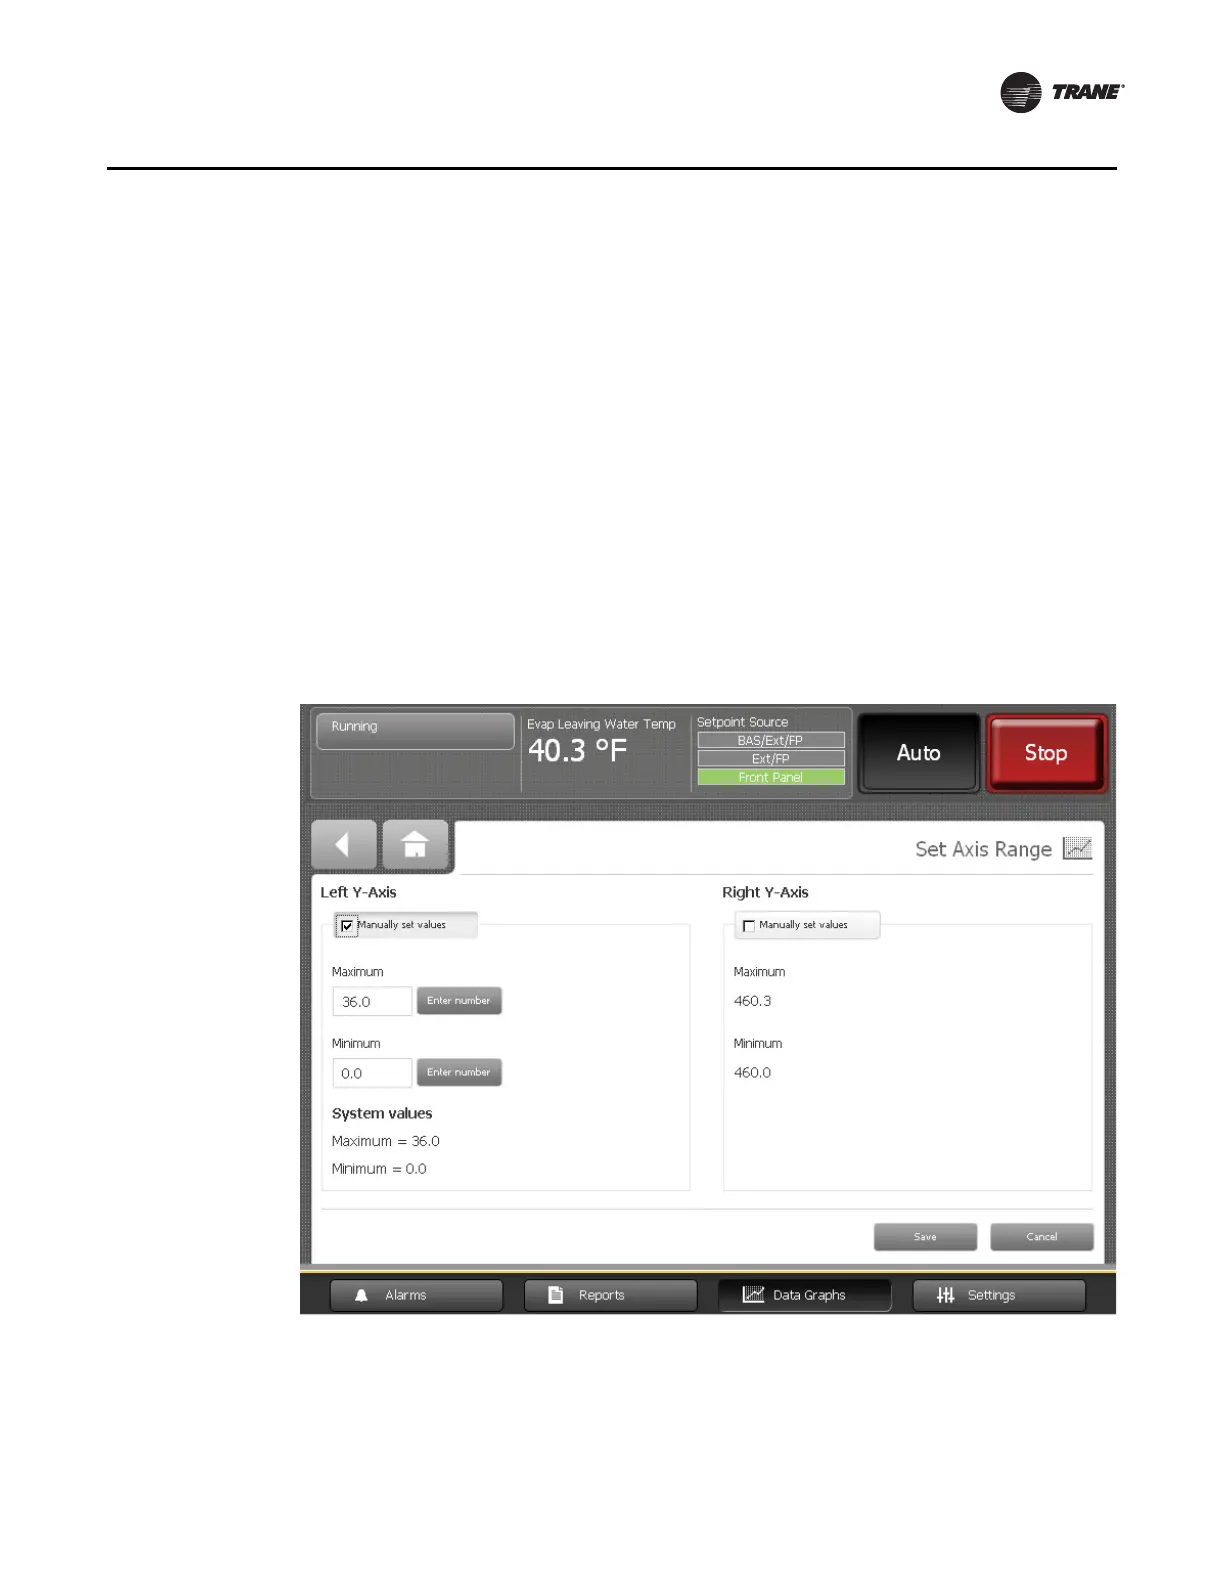
Changing the scale of the Y-axes
The Y-axes scales have a default range that varies for each data graph. You can change
the range for each graph.
1. Touch the Edit Y-Axis button at the bottom of a data graph that you want to edit (see
Figure 12 as an example). The Set Axis Range screen appears (Figure 13). The screen
shows the minimum and maximum values for that particular graph.
2. Touch the Manually set values button under either the Left Y-Axis or Right Y-Axis
heading. Enter number buttons appear to the right of the minimum and maximum
values.
Figure 13. Set Axis Range screen
 Loading...