32 Tracer AdaptiView Display Operations Guide • CTV-SVU01B-EN
Data Graphs
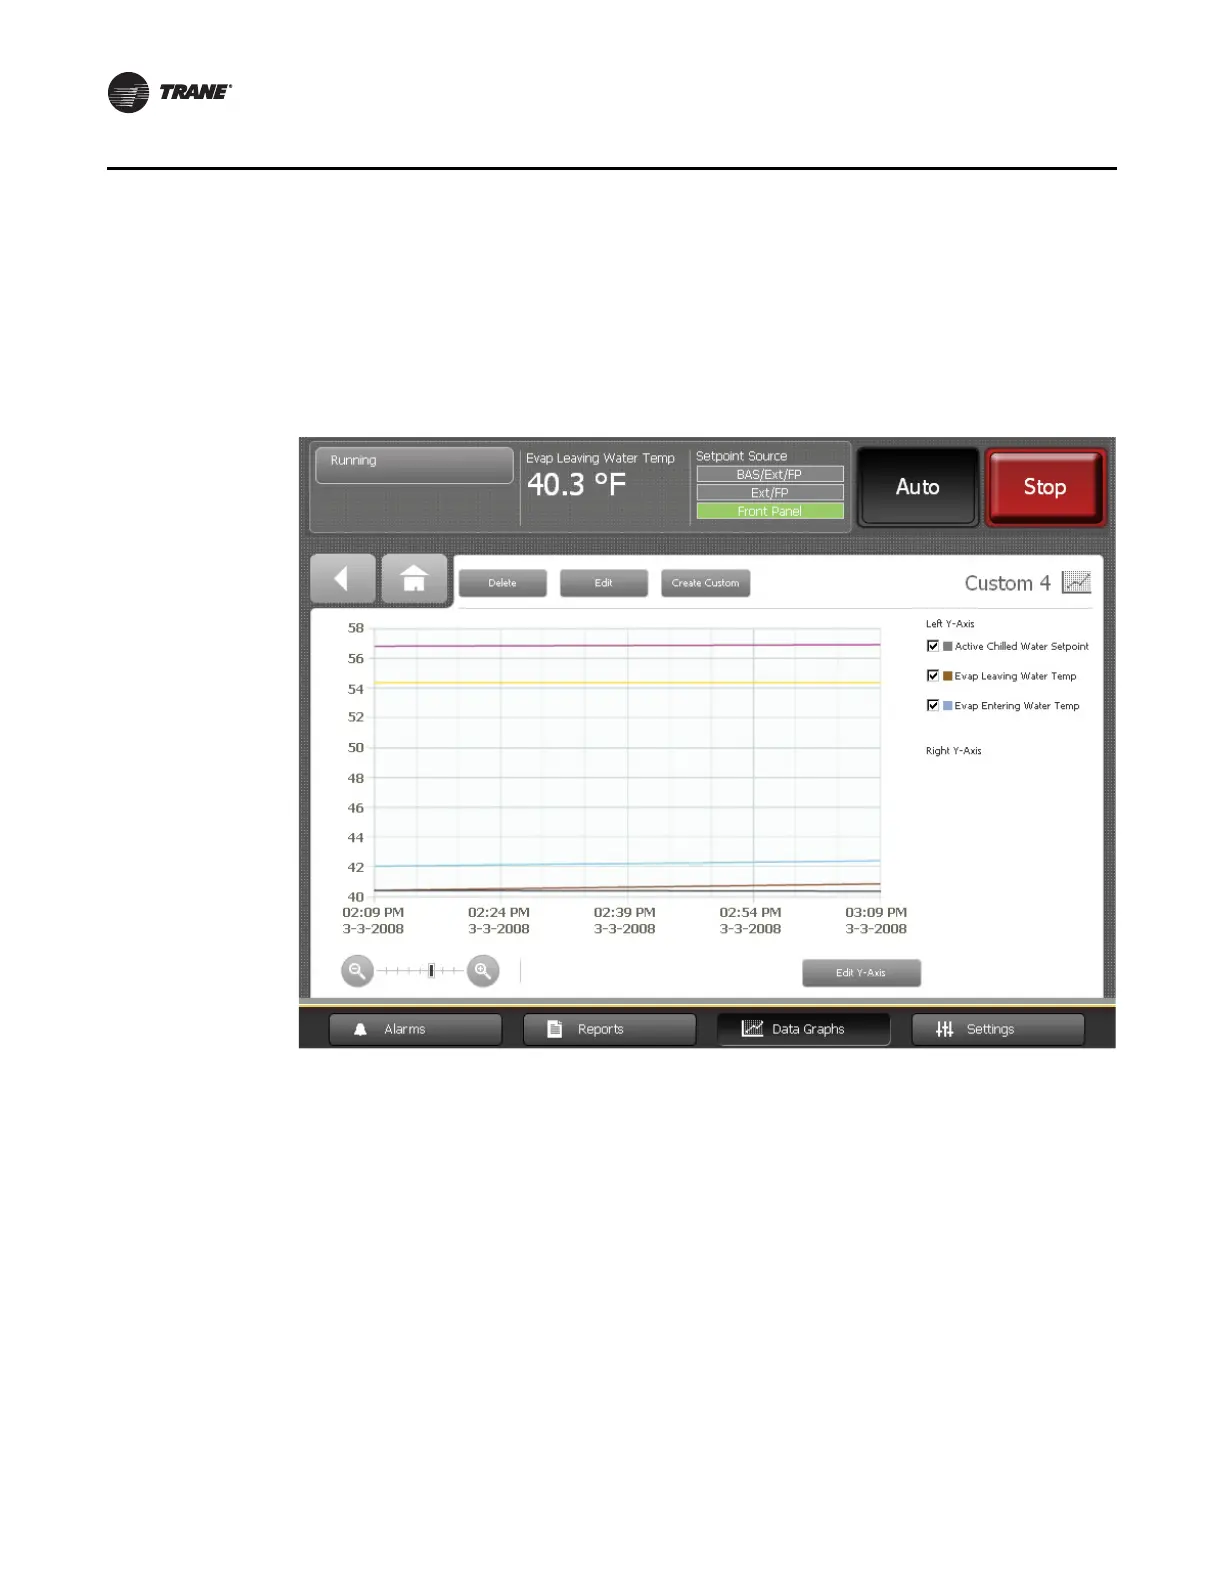
5. When you are finished choosing data points, touch Save. The Data Graph Points
screen appears. Touch the Finished button to view the custom data graph you have
just created (Figure 16, p. 32).
Note: To edit the appearance of data points in the graph, see “Editing Custom Data
Graphs,” p. 33.
Creating a custom data graph with no previously defined data graph points
1. Touch the Create Custom button at the top left of the Data Graphs screen (Figure 11,
p. 27). The Add/Remove screen appears (see Figure 15, p. 31), but with no data on the
screen.
2. Continue by following steps 3 through 5 of “Creating a custom data graph from a
default data graph,” p. 30.
Figure 16. Custom data graph example
 Loading...