30 Tracer AdaptiView Display Operations Guide • CTV-SVU01B-EN
Data Graphs
3. Touch the Enter number button for the value you want to change. A keypad appears
on the screen.
4. Touch the appropriate numbers to change the current value. The new value appears
above the keypad.
5. Touch the Enter button. The graph you were previously viewing appears with
changed maximum and/or minimum values.
6. Touch Save. The data graph appears with changed Y-axes scales.
Creating Custom Data Graphs
You can create a custom data graph in two ways:
• By starting with a default data graph
• By starting from a blank screen, with no previously defined data graph points
Creating a custom data graph from a default data graph
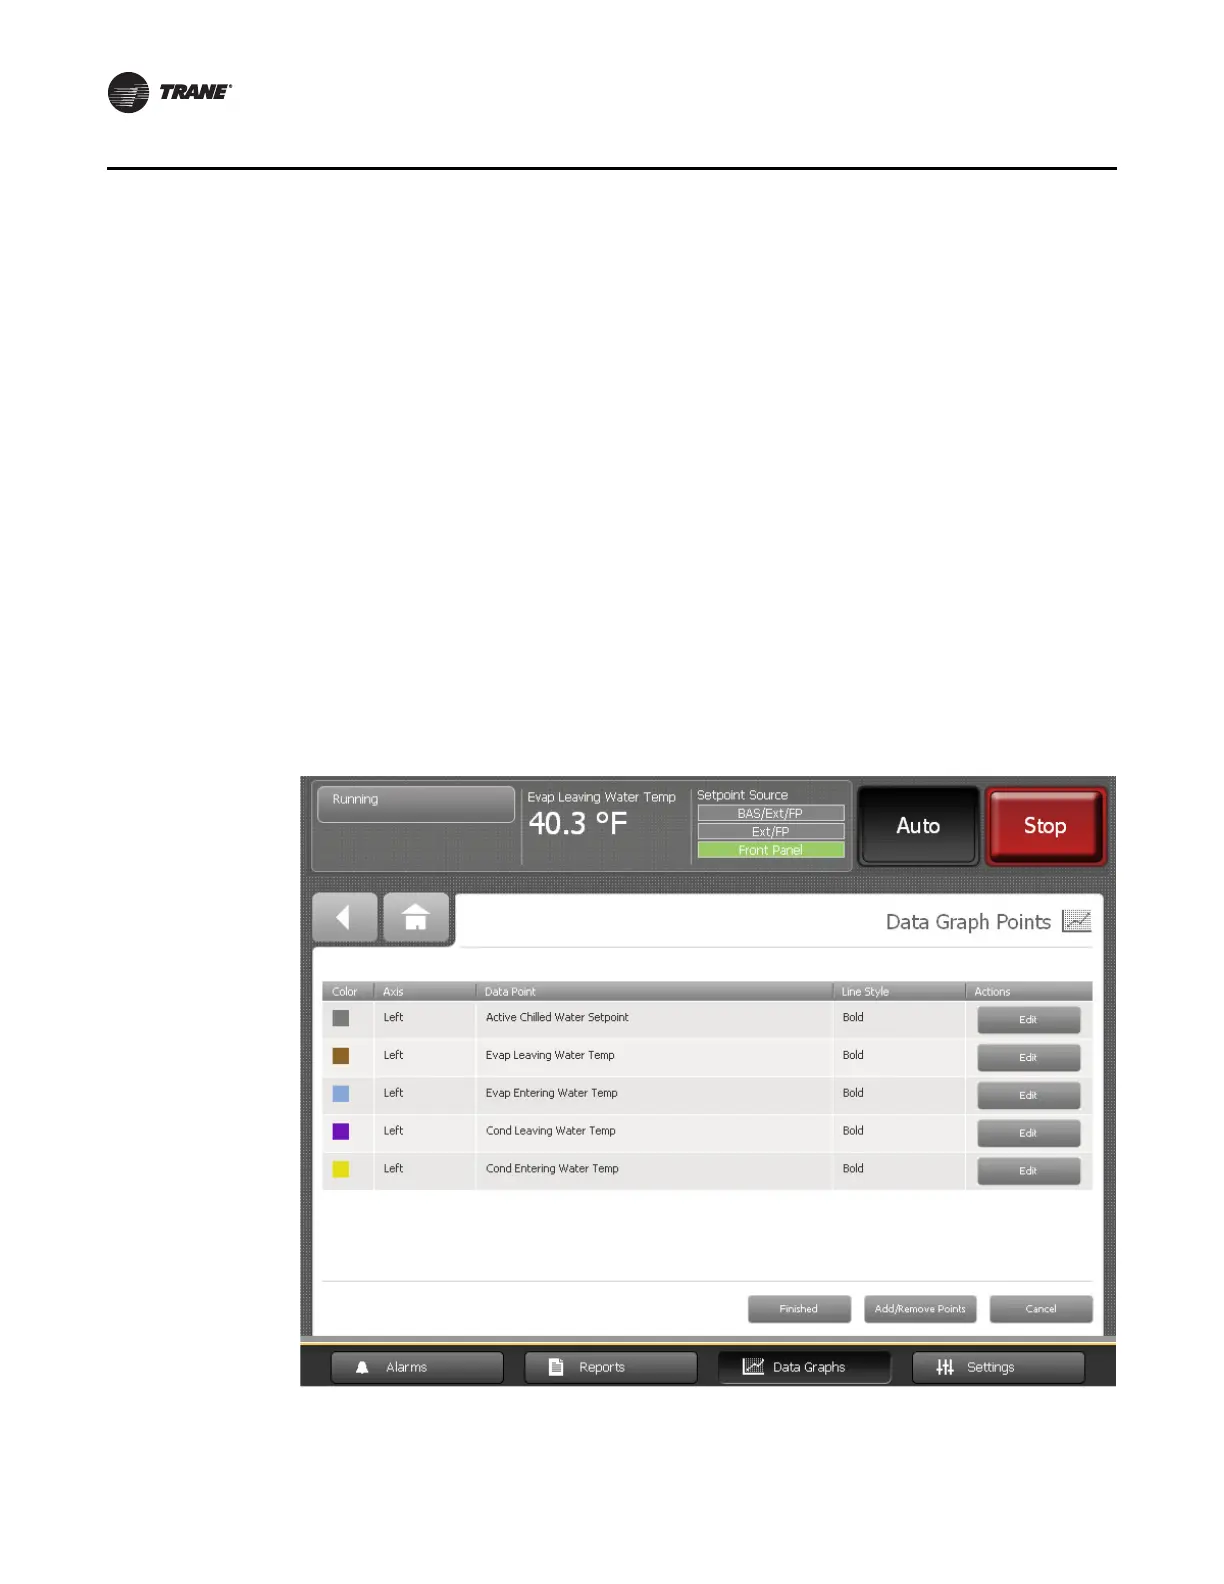
1. Touch the Create Custom button at the top left of any default data graph screen (see
Figure 12, p. 28, for example). The Data Graph Points screen appears (Figure 14).
Figure 14. Data Graph Points screen
 Loading...