Chapter 5 _______________________________________________________ Functional Description
VAISALA _______________________________________________________________________ 103
Measurement Signal Processing
Optical Signal Processing
The software running in the FDP12 CPU controls the measurement
hardware and reads the data samples. The FD12P measures in
15- second cycles as follows:
- 10 s signal frequency and analog monitoring voltages are
measured
- 1 s receiver backscatter frequency
- 4 s offset frequency (internal noise level)
The hardware outputs an optical measurement sample every 8 ms (on
the average). The raw samples are first classified by frequency to get a
signal distribution. The distribution is then analyzed with a proprietary
algorithm, which selects a part of the distribution for signal average
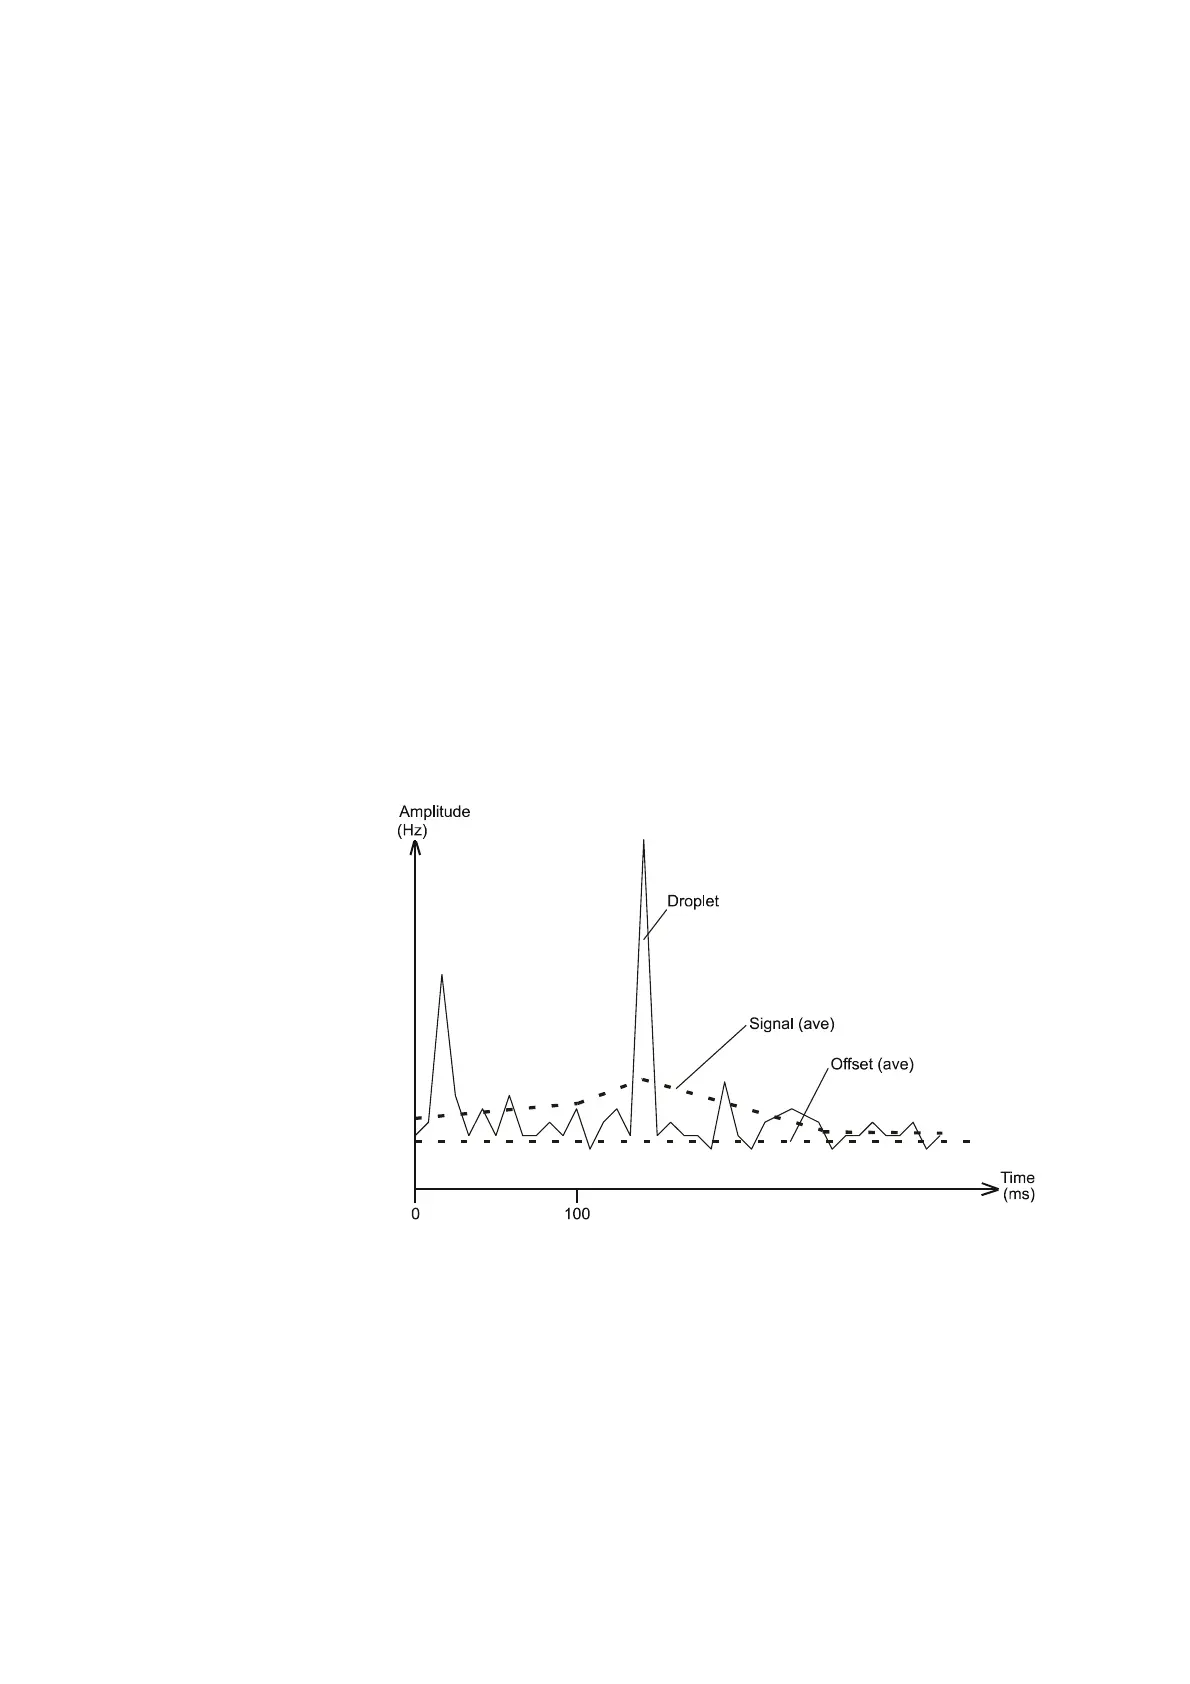
calculation (Figure 27 below). The difference of the signal average
and offset average is used in the visibility calculation.
9807-033
Figure 27 Optical Raw Data (in Rain)
Precipitation causes peaks in the optical signal. These peaks are
analyzed by calculating an amplitude change distribution from the
samples. Because the signal amplitude is proportional to the droplet
size, the amplitude change distribution can be interpreted as the
droplet size distribution. The droplet size distribution is an important
parameter in determining the form of precipitation.