Operating mode: BOD Standard / BOD Routine OxiTop
®
Control OC 100
34 ba31114e06 06/2012
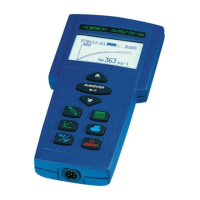
5.5.4 Curves display for cold samples
1 The scaling of the Y-axis
is automatically adapted
to the measured value
2 Measuring time at the
cursor position
3 Measured value at the
cursor position
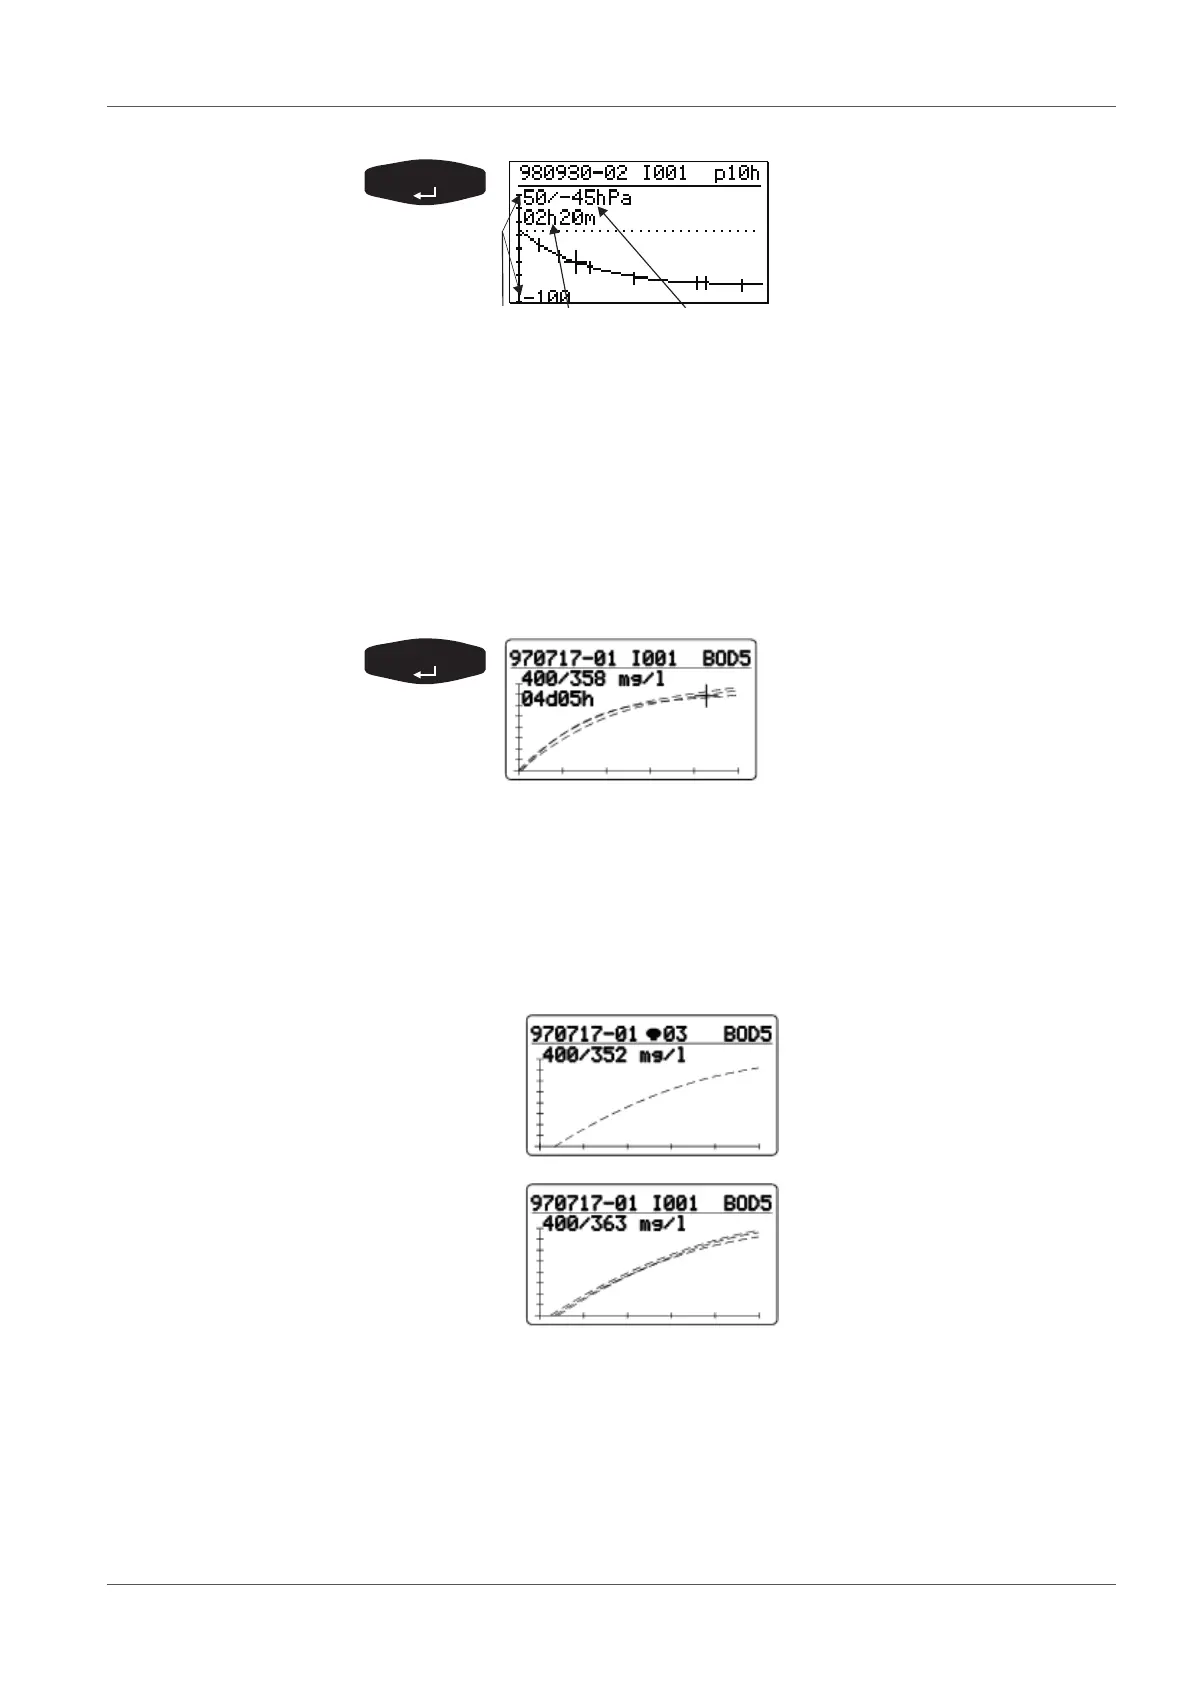
Use <><> to run through the
curve values.
Use <PRINT> to print out the
current display.
Or from the display of all the single curves:
Use <><> to run through the
curve mean values.
Use <PRINT> to print out the
current display.
Return to the previous menu using <RUN/ENTER>.
Return to the display of all the single curves using <GRAPH>.
Display of a single curve.
Display of all curves.
If samples that are too cold are incubated, the max. AutoTemp time is not suf-
ficient for the sample temperature to reach the incubation temperature:
Warming the sample can cause excess pressure.
Display: Negative values of the curve will be truncated and the curve
arises from the time axis but not the origin.