7-33
IM WT3001E-51EN
Harmonic Measurement in Normal Measurement Mode (Option)
7
Explanation
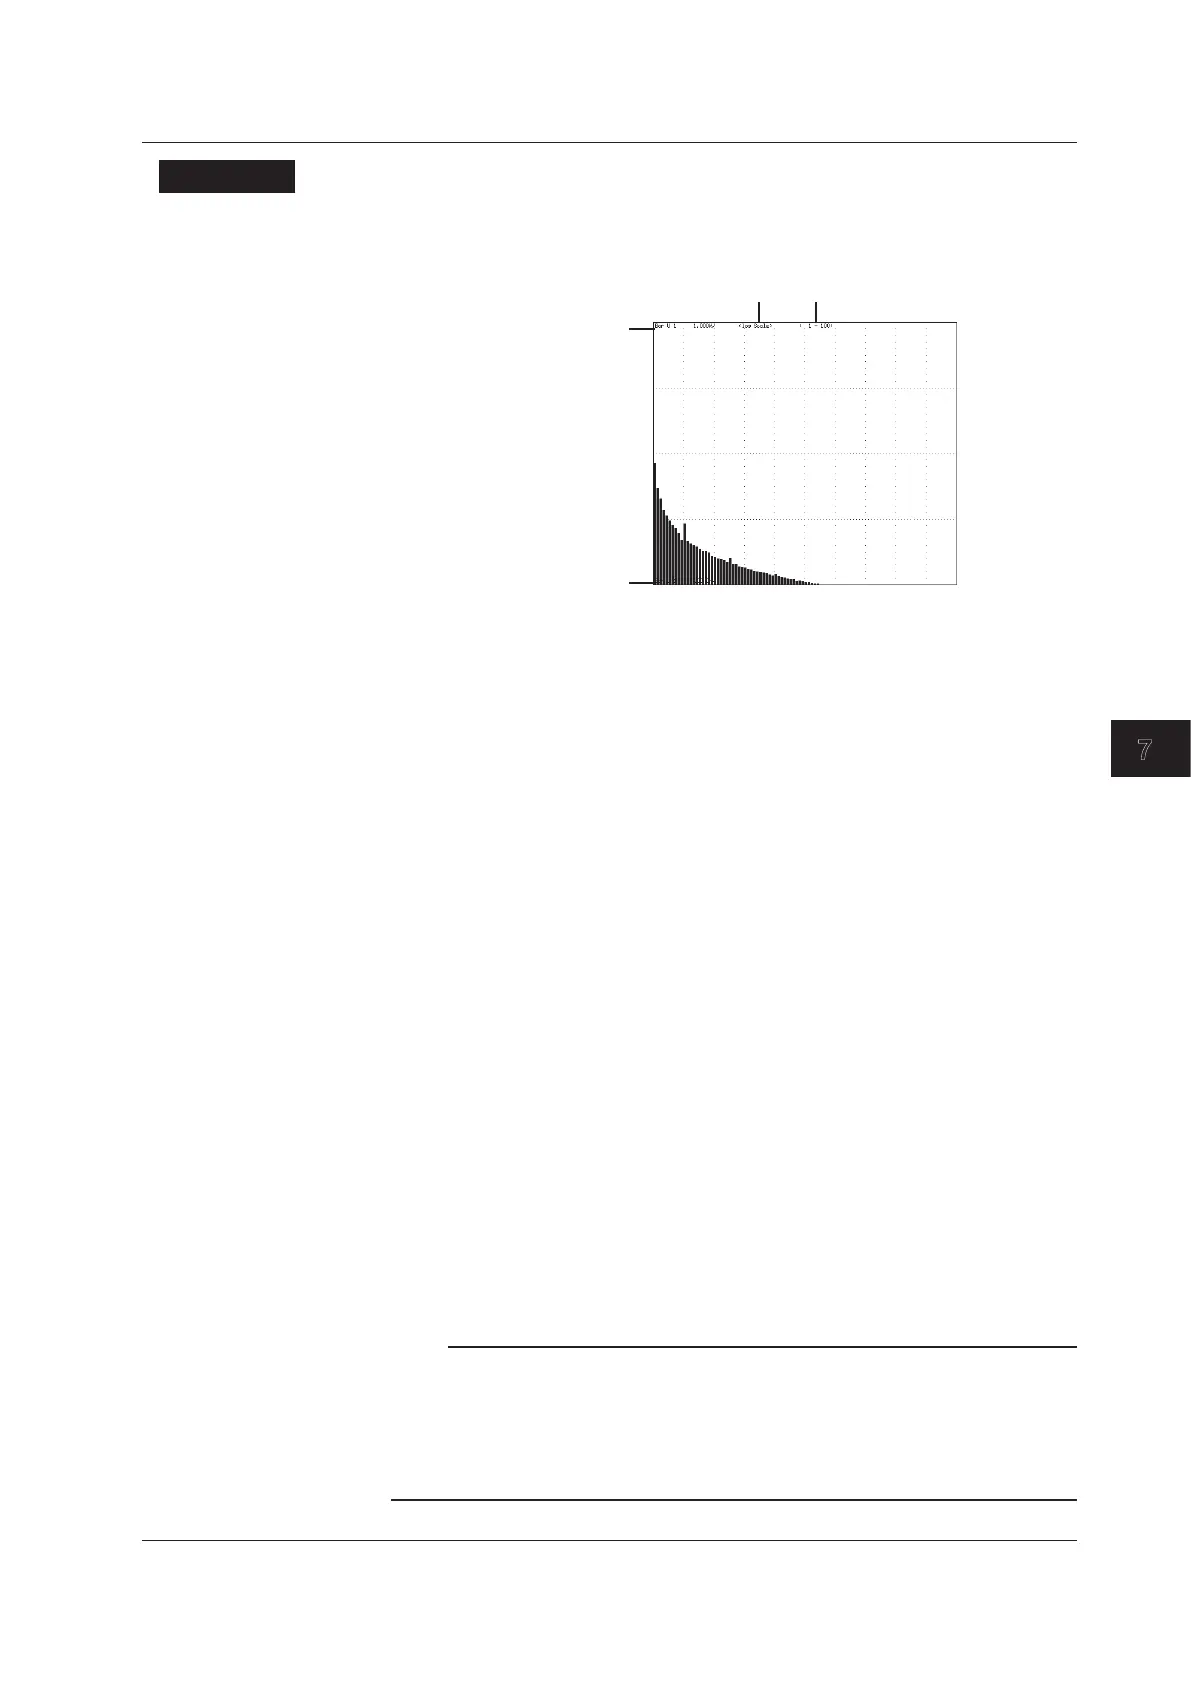
A display example is shown below. The vertical axis is in logarithmic scale. The word
<log Scale> appears at the top section of the screen.
Distinction of voltage or current,
the element, and the upper limit
of the displayed bar graph
Distinction of voltage or current,
the element, and the lower limit
of the displayed bar graph
displayed bar graph
<log Scale>
• Selecting the Display Mode
Select the bar graph display format from the choices below.
• Displaying the Bar Graph on the Entire Screen
Press Bar to display the bar graph on the entire screen.
• Displaying the Bar Graph by Dividing the Screen into Halves (Split Display)
• Numeric+Bar
The numeric data and bar graph are displayed separately in the top and bottom
windows.
• Wave+Bar
The waveform and bar graph are displayed separately in the top and bottom
windows.
• Bar+Trend
The bar graph and trend are displayed separately in the top and bottom
windows.
• Changing the Measurement Function
Select the measurement function to be changed from the choices below.
U,I,P,S,Q,λ,φ,φU,φI,Z,Rs,Xs,Rp,andXp
• Changing the Element
Select the element from the choices below. The selectable items vary depending on
the installed elements.
Element1, Element2, Element3, and Element4
• Selecting the Item to Be Changed
Three types of bar graphs can be specified. Select the type from 1 (bar graph 1) to 3 (bar
graph 3).
Note
• For data whose value is negative, the absolute value of the data is displayed with a red bar
graph.
• If the analysis window width (frequency of the fundamental signal) that is determined by the
fundamental frequency is shorter in time than the data update interval, the bar graph is not
displayed. If this happens, decrease the data update interval. The details are the same as
with harmonic data. See the note in section 7.3.
7.9 Displaying the Bar Graph and Making Cursor Measurements
 Loading...