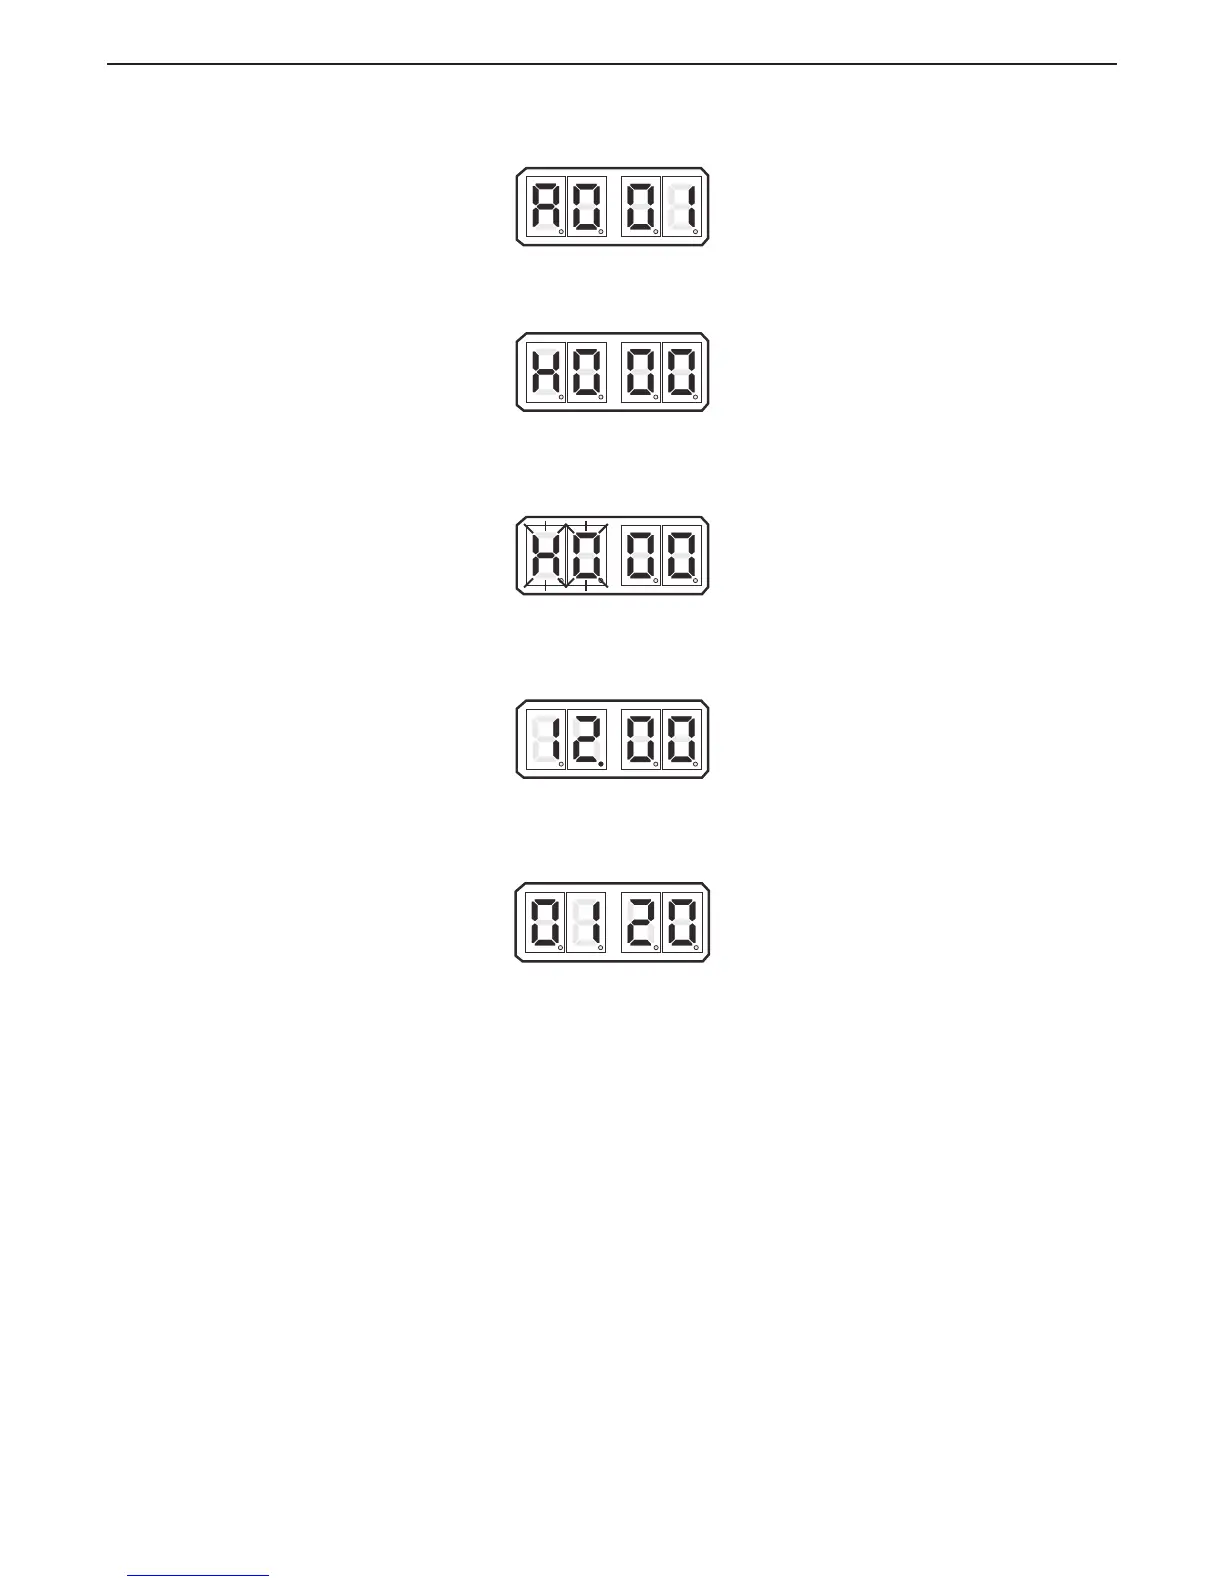
B Depress the Up or Down Push Button to activate the Function Code List. The characters A001 will be
shown on the Display like Figure 10-6: Display Function Code List
Figure 10-6: Display Function Code List
C Depress the Up or Down Push Button repeatedly until H000 is displayed like Figure 10-7: Display
Troubleshooting Function.
Figure 10-7: Display Troubleshooting Function
D Depress and hold the Left and Right Push Buttons simultaneously until the H0 begins to blink. (Figure
10-8: Display Troubleshooting Function Blinking) Release the Push Buttons; the applied battery
voltage will now be displayed:
Figure 10-8: Display Troubleshooting Function Blinking
• The displayed value is in “real time” and provides a rough estimate of the DC voltage applied
to the Processor. The reading is accurate to within 0.50 DC. Refer to Figure 10-9: Example
Display of Applied Battery Voltage
Figure 10-9: Example Display of Applied Battery Voltage
E In addition to the applied battery voltage, scrolling through the Diagnostics Menu by pressing the Up
or Down Push Button can also show the Tachometer Sender Frequency (Figure 10-10: Example
Display of Tach Sensor Frequency):
Figure 10-10: Example Display of Tach Sensor Frequency
• The information shown is the actual frequency outputted by the Tachometer Sender. This
signal is utilized in “Closed Loop” Synchronization or “Closed Loop” Troll (future) systems
• The Control Head’s lever position, and the resulting outputs of Stations # 1, 2, 3, 4, and 5’s
Control Heads can always be monitored. This is regardless of whether that Station is in
command or not. Note the placement of the decimal points in the examples below, which
 Loading...