Rev. Date: 23-May-12 Art: 716969-00J BNP - 7
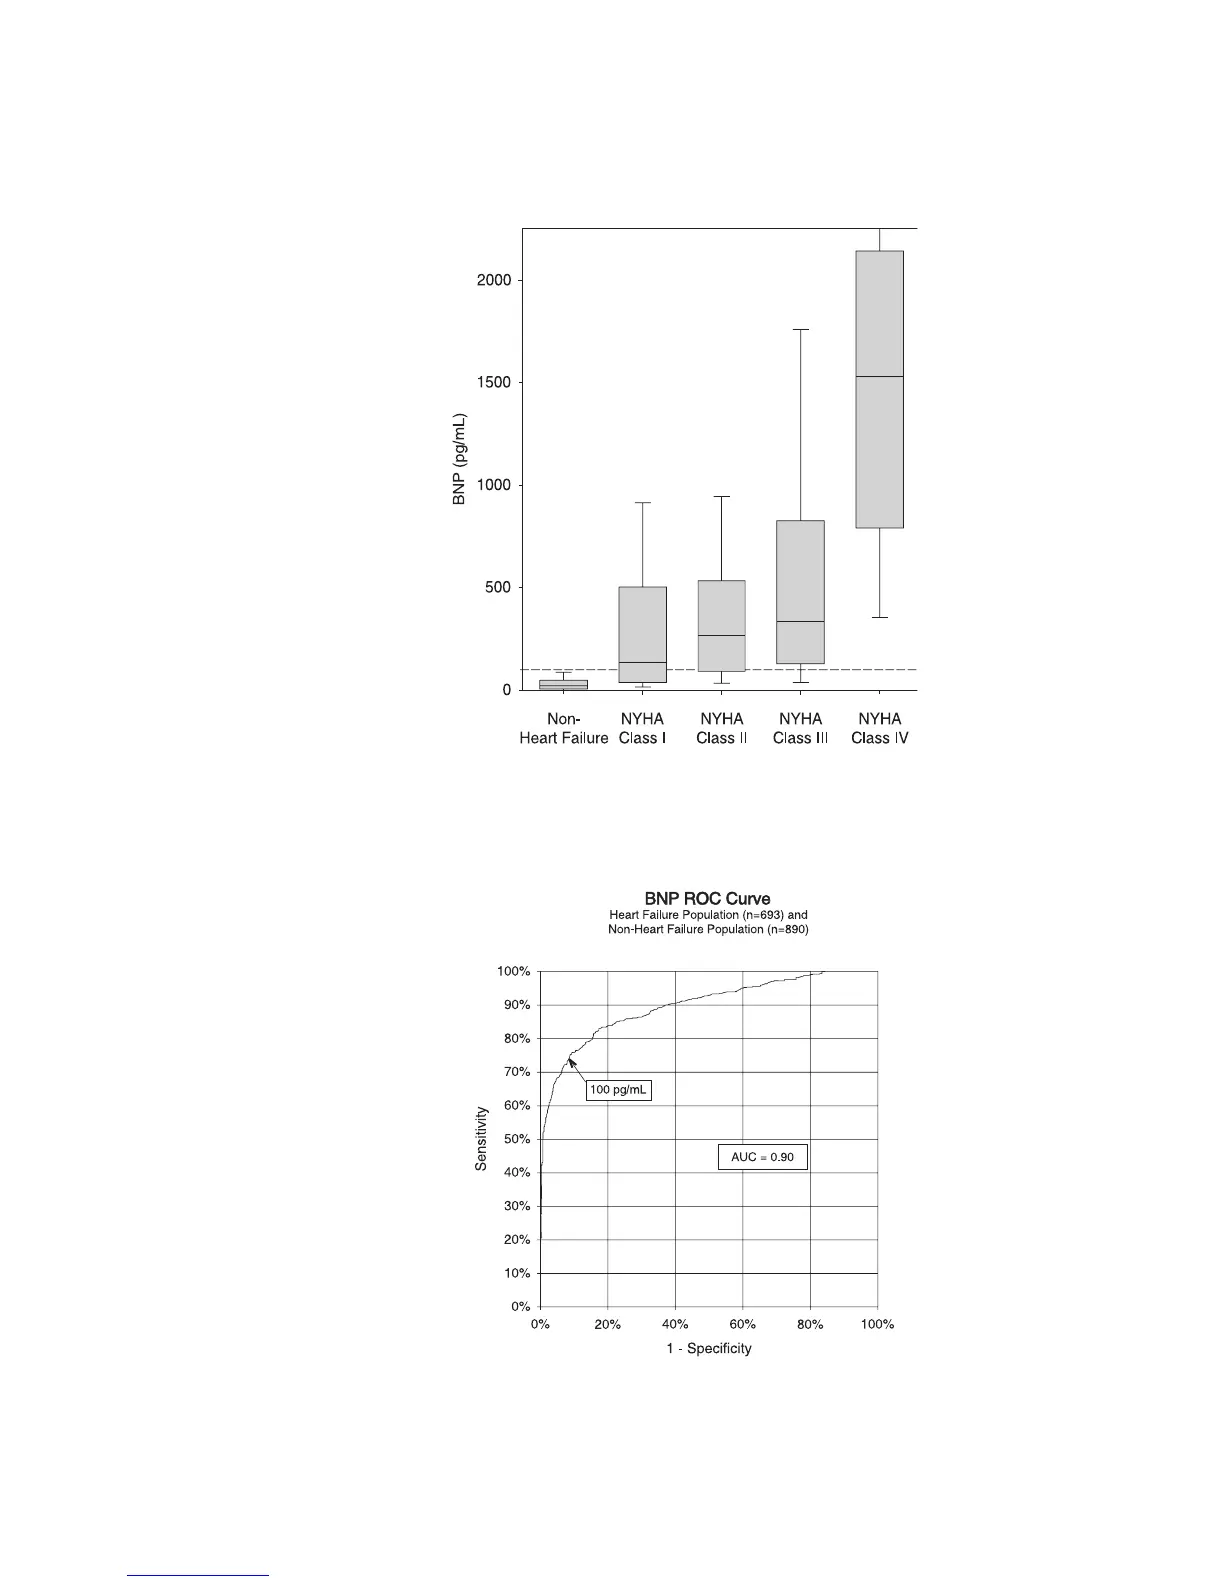
A box and whiskers plot of the clinical study population, broken down by NYHA classification, is presented
in the following graph. The dashed line represents 100 pg/mL, the suggested decision threshold for the
AxSYM BNP assay. In support of previous literature reports,
23
these data show a progressive increase in
BNP concentrations with increases in NYHA classifications. This analysis indicates that BNP measurements
provide objective information for use in the assessment of the severity of heart failure.
Data from the above clinical study were used to generate the Receiver Operating Characteristic (ROC) curve
of BNP decision thresholds versus clinical sensitivity and clinical specificity as shown in the following graph.
At a decision threshold of 100 pg/mL, the BNP assay demonstrated a clinical sensitivity and specificity of
74.2% and 91.5% respectively, in this study. The area under the curve (AUC) is 0.90 (0.86 to 0.92, 95% CI).
 Loading...