4-22
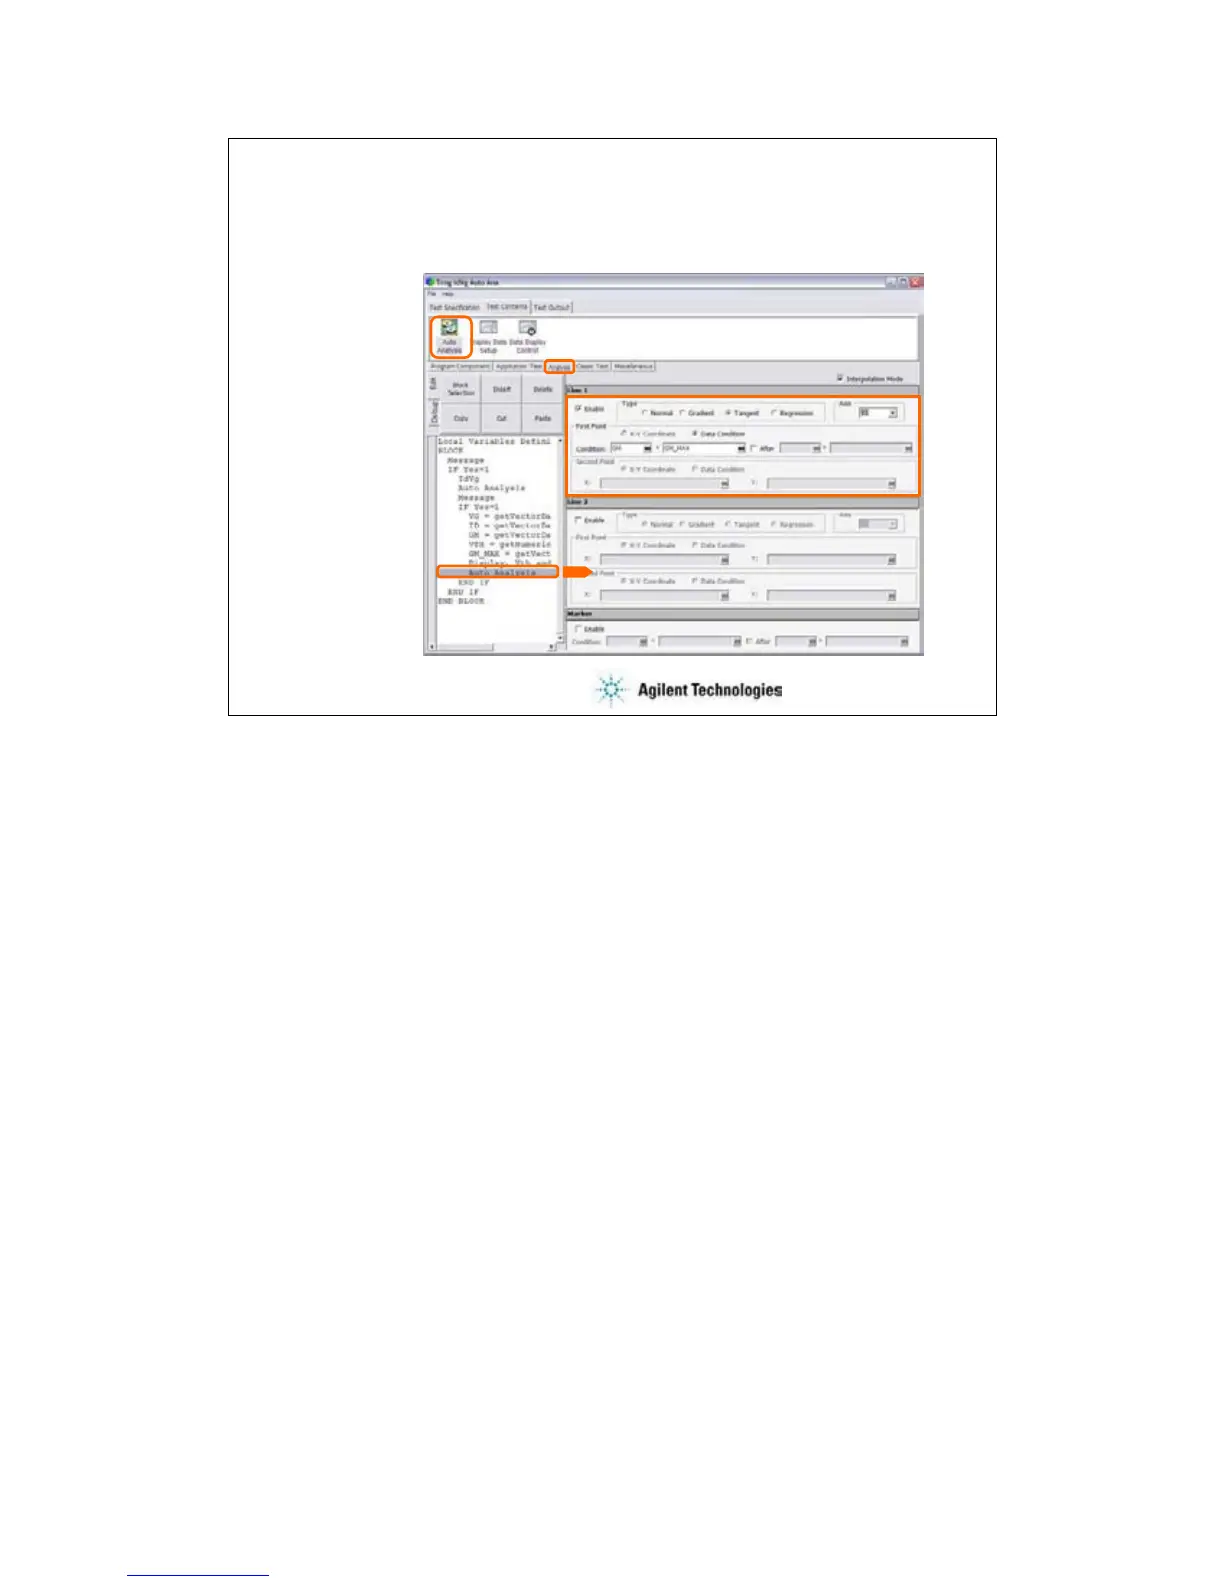
To Use Auto Analysis Function
Analysis: Auto Analysis
• Line 1
• Line 2
• Marker
GM=GM_MAX
The Auto Analysis statement provides the setup editor used to set up the automatic analysis
function. When a measurement finishes, the function automatically draws lines, a marker, or
both on the X-Y Graph of the Data Display window.
You can set up two lines and one marker for the automatic analysis function by using the setup
editor.
In the Line 1 and Line 2 areas, you can set up the lines to be drawn.
In the Marker area, you can set up the marker.
The above example draws the tangent line for the Y1 data at the maximum GM point.
 Loading...