3-3
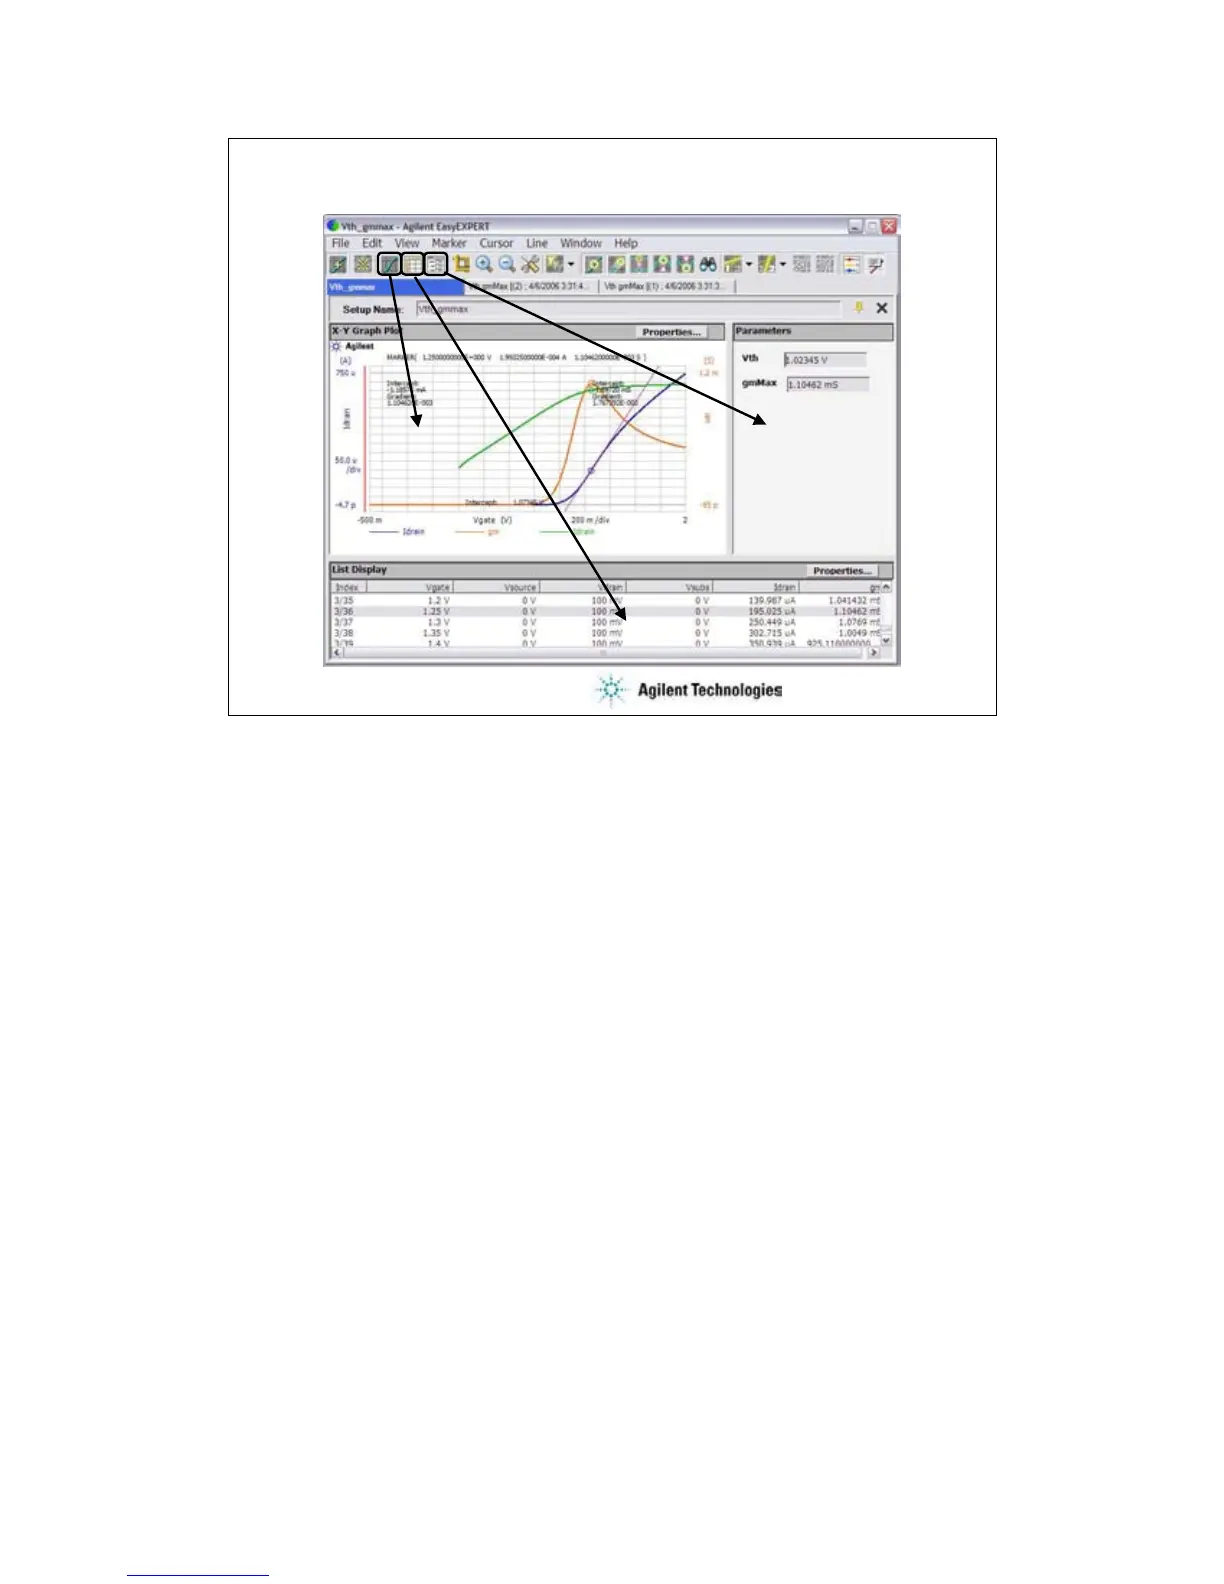
Data Display window
X-Y Graph PLot
Parameters
List Display
The Data Display window is opened after measurement automatically, or by clicking the Data
Display button. And the window is used to display measurement data and analyze the data.
The Show X-Y Graph icon displays/hides the X-Y Graph Plot area. This is the same as the View >
X-Y Graph menu.
The Show List Display icon displays/hides the List Display area. This is the same as the View >
List Display menu.
The Show Parameters icon displays/hides the Parameters area. This is the same as the View >
Parameters menu.
 Loading...