6-24
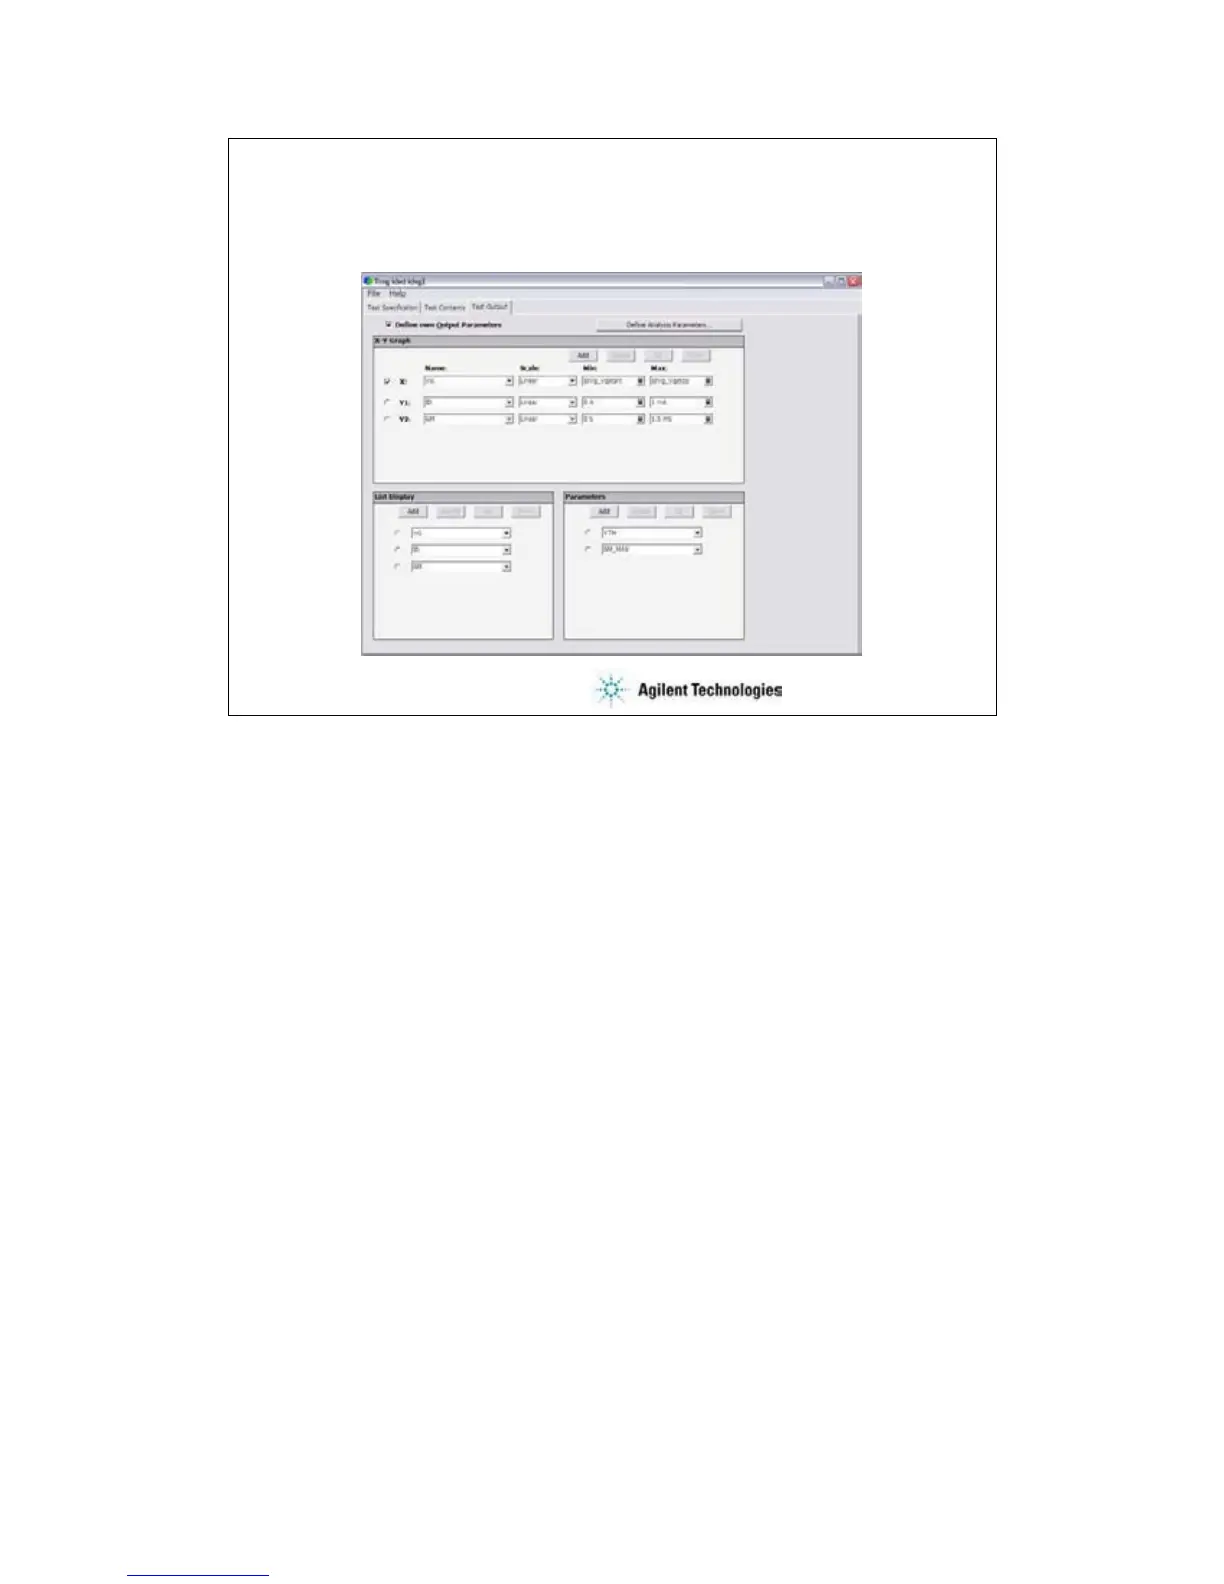
Step 2. To set display parameters
This example sets:
X-Y Graph: ID-VG plot for Y1-X graph and GM-VG plot for Y2-X graph
List Display: VG, ID, and GM
Parameters: GM_MAX and VTH
All parameters must be declared by using the Analysis Parameter Definition window shown in the
previous slide or displayed on the last data display.
 Loading...