EasyManuals Logo

Agilent Technologies B1500A Self-Paced Training Manual

Agilent Technologies B1500A
225 pages
To Next Page IconTo Next Page
To Previous Page IconTo Previous Page
Page #126 background imageLoading...
Page #126 background image
5-19
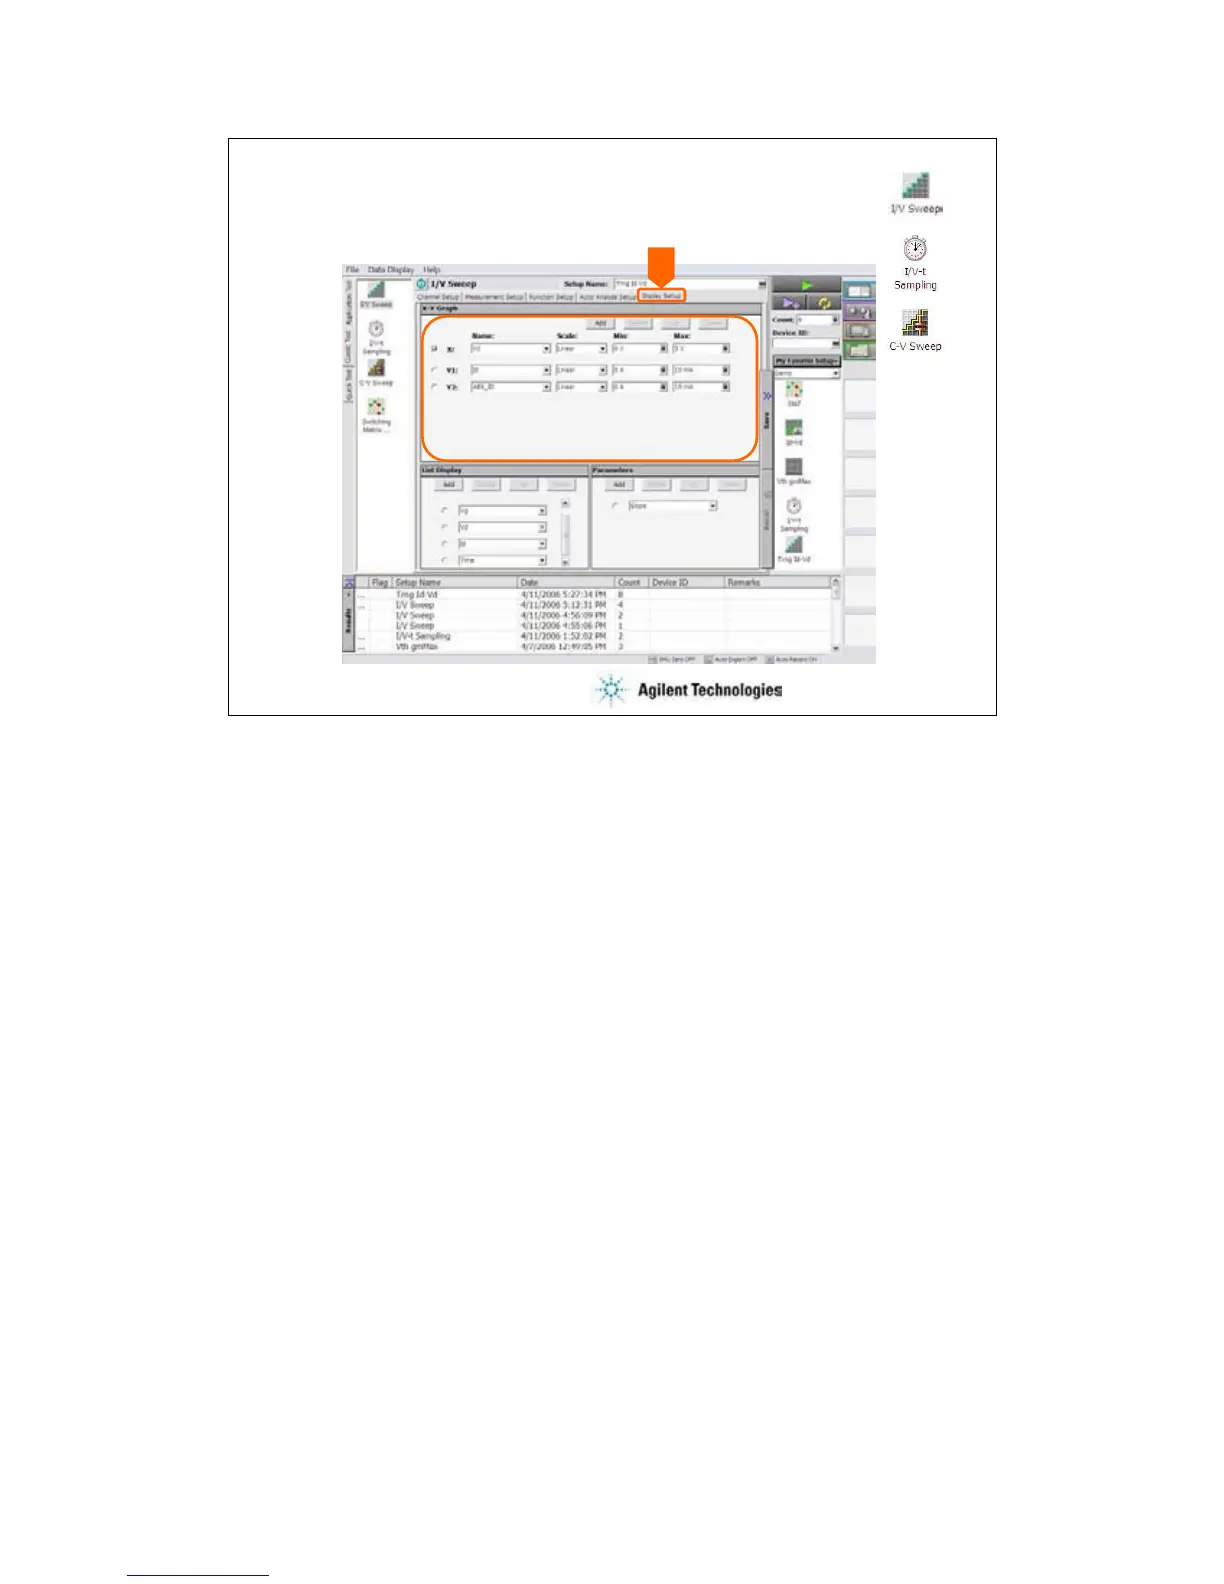
To Set X-Y Graph Display
Display Setup
Specify X axis and Y axis
Click the Display Setup tab to display the display setup screen. The X-Y Graph area is used to set
the X axis and Y axis of the X-Y Graph Plot area in the Data Display window.
•Name: Name of variable to plot on the X axis
•Scale: Linear or Log
•Min: Minimum value of the specified axis
•Max: Maximum value of the specified axis

Other manuals for Agilent Technologies B1500A

Questions and Answers:

Question and Answer IconNeed help?

Do you have a question about the Agilent Technologies B1500A and is the answer not in the manual?

Agilent Technologies B1500A Specifications

General IconGeneral
BrandAgilent Technologies
ModelB1500A
CategoryMeasuring Instruments
LanguageEnglish

Related product manuals