5-33
To Set Data Display
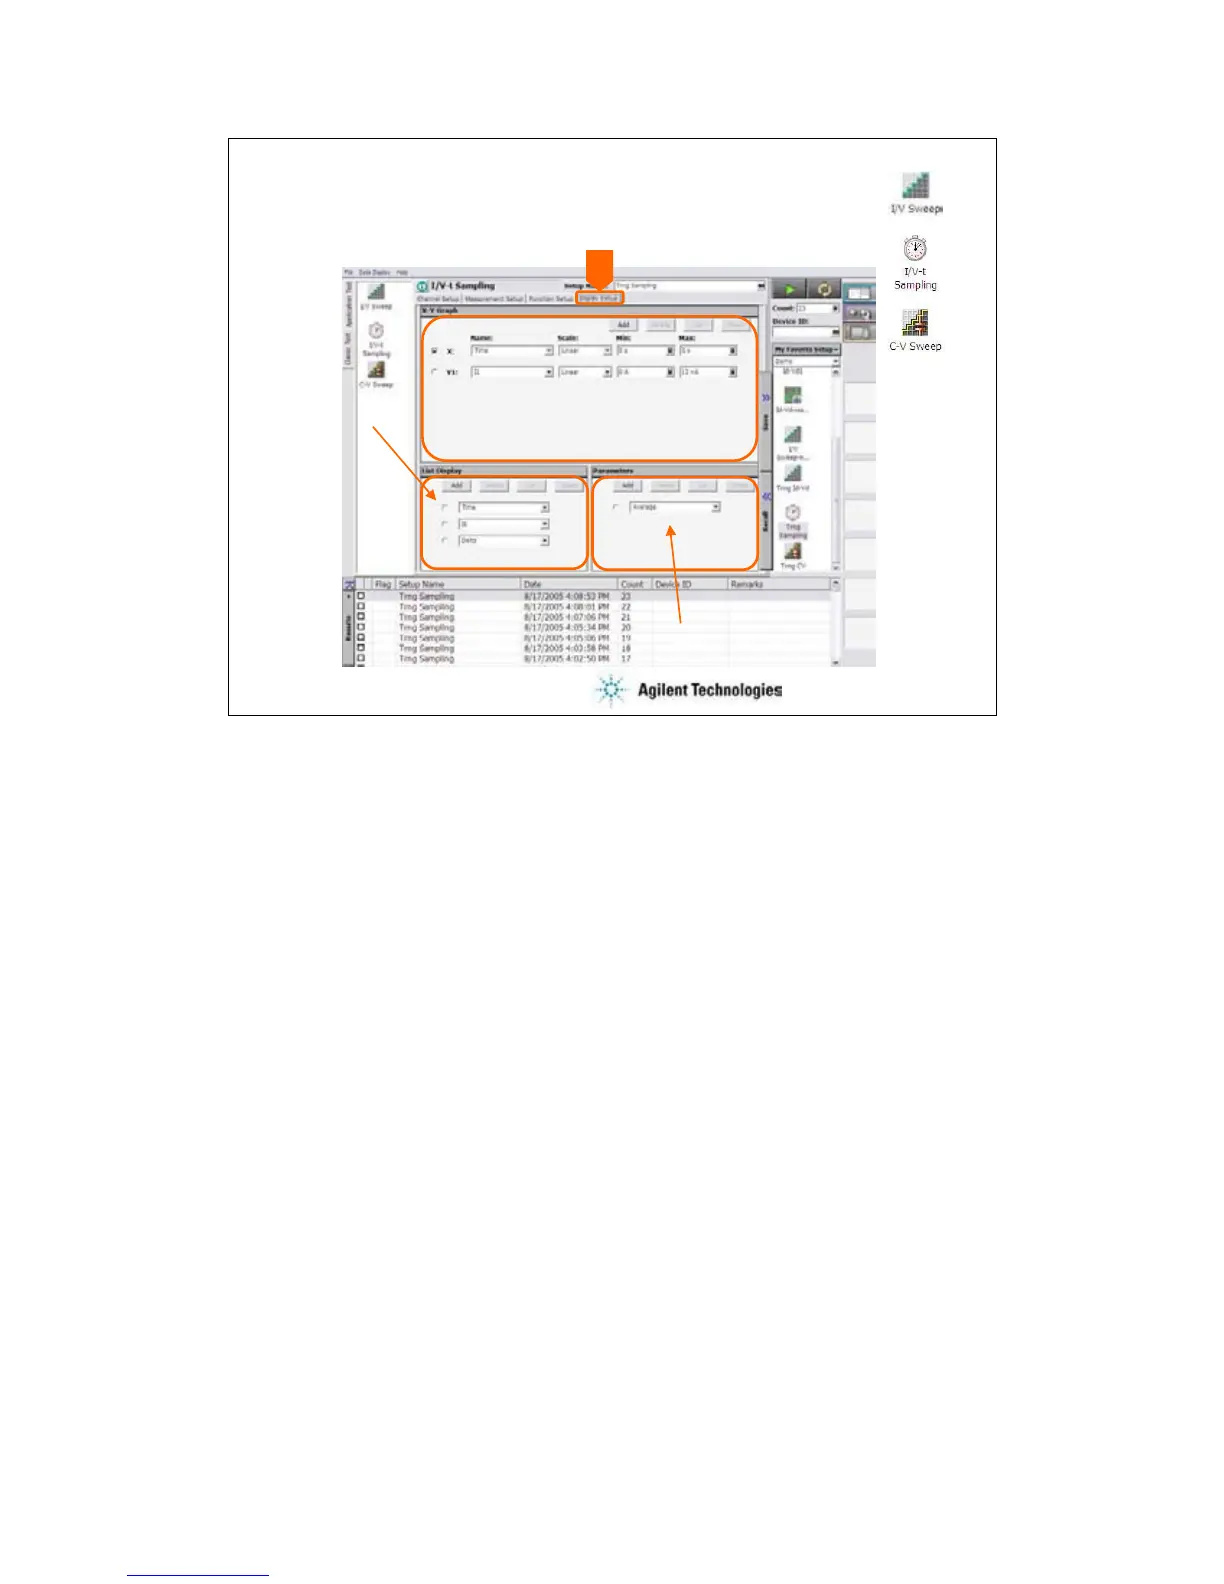
Display Setup
Specify X axis and Y axis
Select parameters to display
Select variables to list
Click the Display Setup tab to display the display setup screen. The X-Y Graph area is used to set
the X axis and Y axis of the X-Y Graph Plot area in the Data Display window.
•Name: Name of variable to plot on the X axis
•Scale: Linear or Log
•Min: Minimum value of the specified axis
•Max: Maximum value of the specified axis
The List Display area selects the variables to be listed in the List Display area of the Data Display
window. Up to 20 variables can be set.
The Parameters area selects the variables to be listed in the Parameters area of the Data Display
window. Up to 20 parameters can be set.
 Loading...