3-15
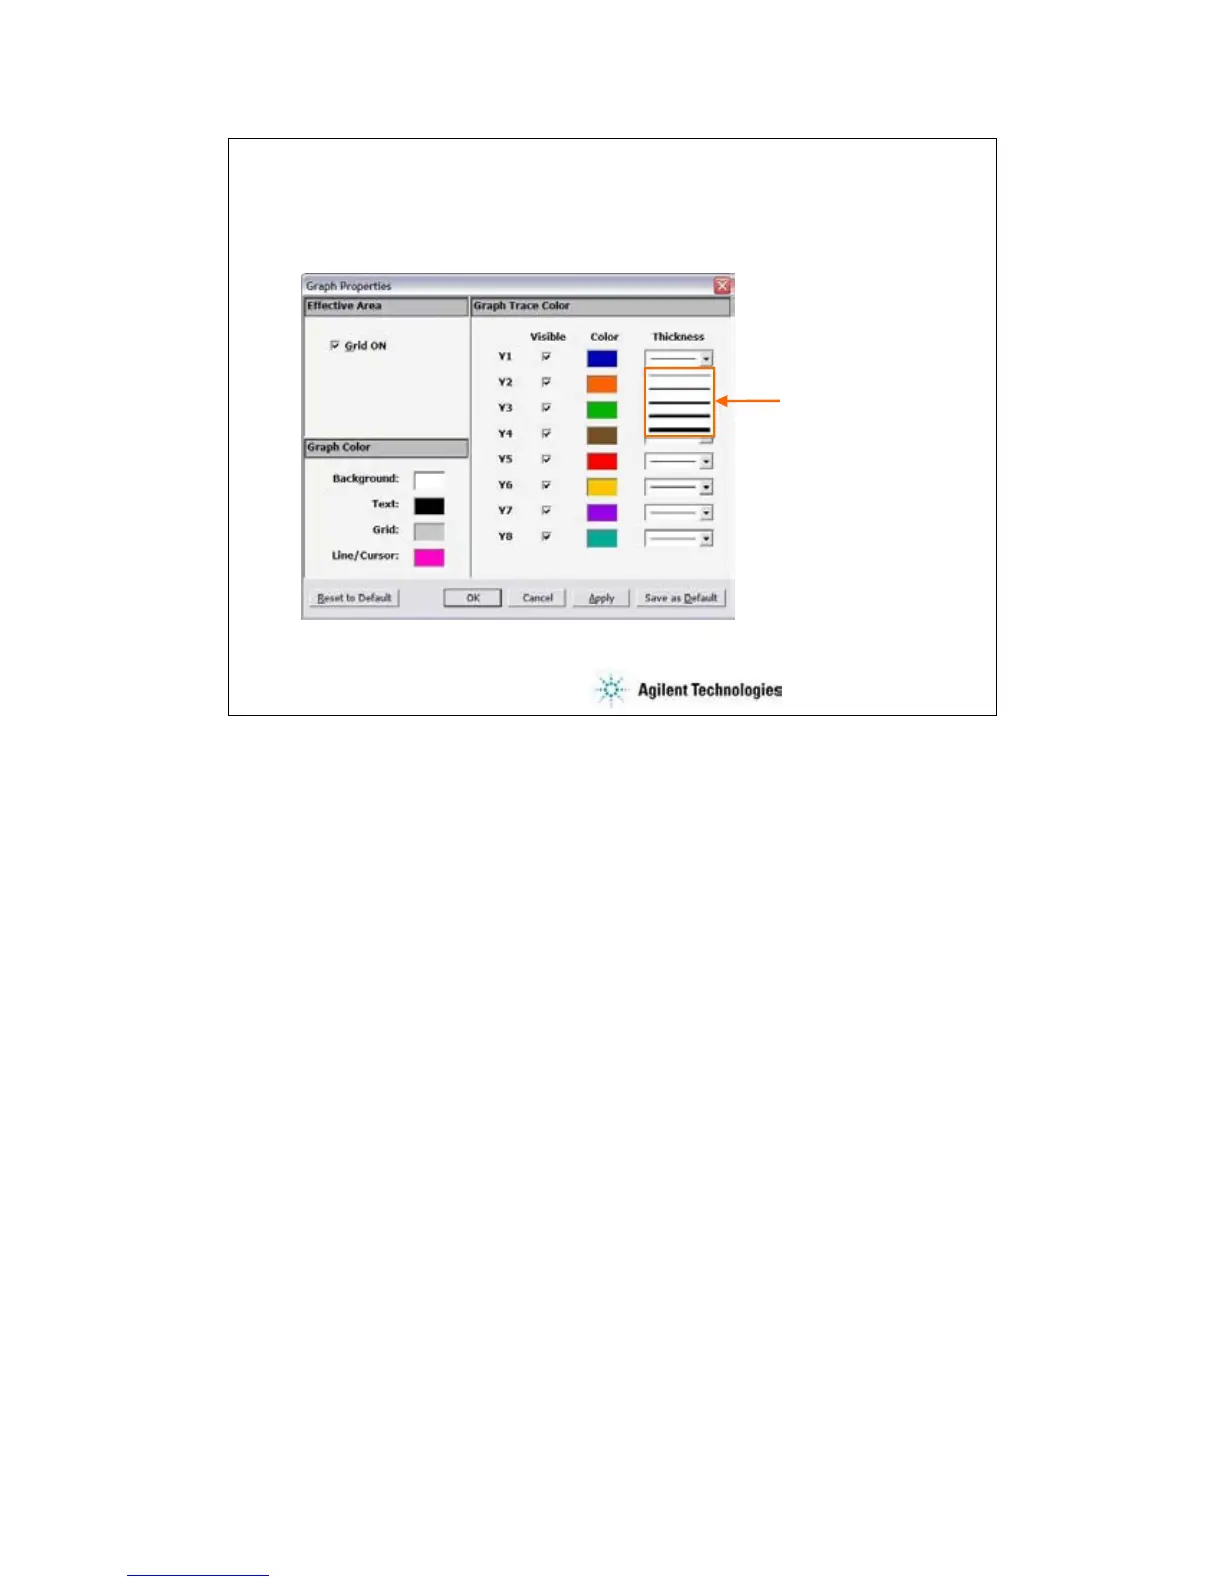
To Change Graph Properties
Edit > Graph Properties…
Variety of thickness
The Graph Properties dialog box is used to set the following setting of the selected Data Display
window. This dialog box is opened by clicking the Properties... button in the X-Y Graph Plot area
or by selecting the Edit > Graph Properties... menu of the Data Display window.
The Grid ON check box in the Effective Area is used to display the grid in the X-Y Graph.
The Graph Color area is used to set the color map of the Data Display window. You can change
the color of the graph background, text, graph grid, and line. The color palette is opened by
clicking the pattern of the item.
The Graph Trace Color area is used to set visibility, color, and thickness of the data traces Y1 to
Y8 plotted in the graph.
 Loading...