3-17
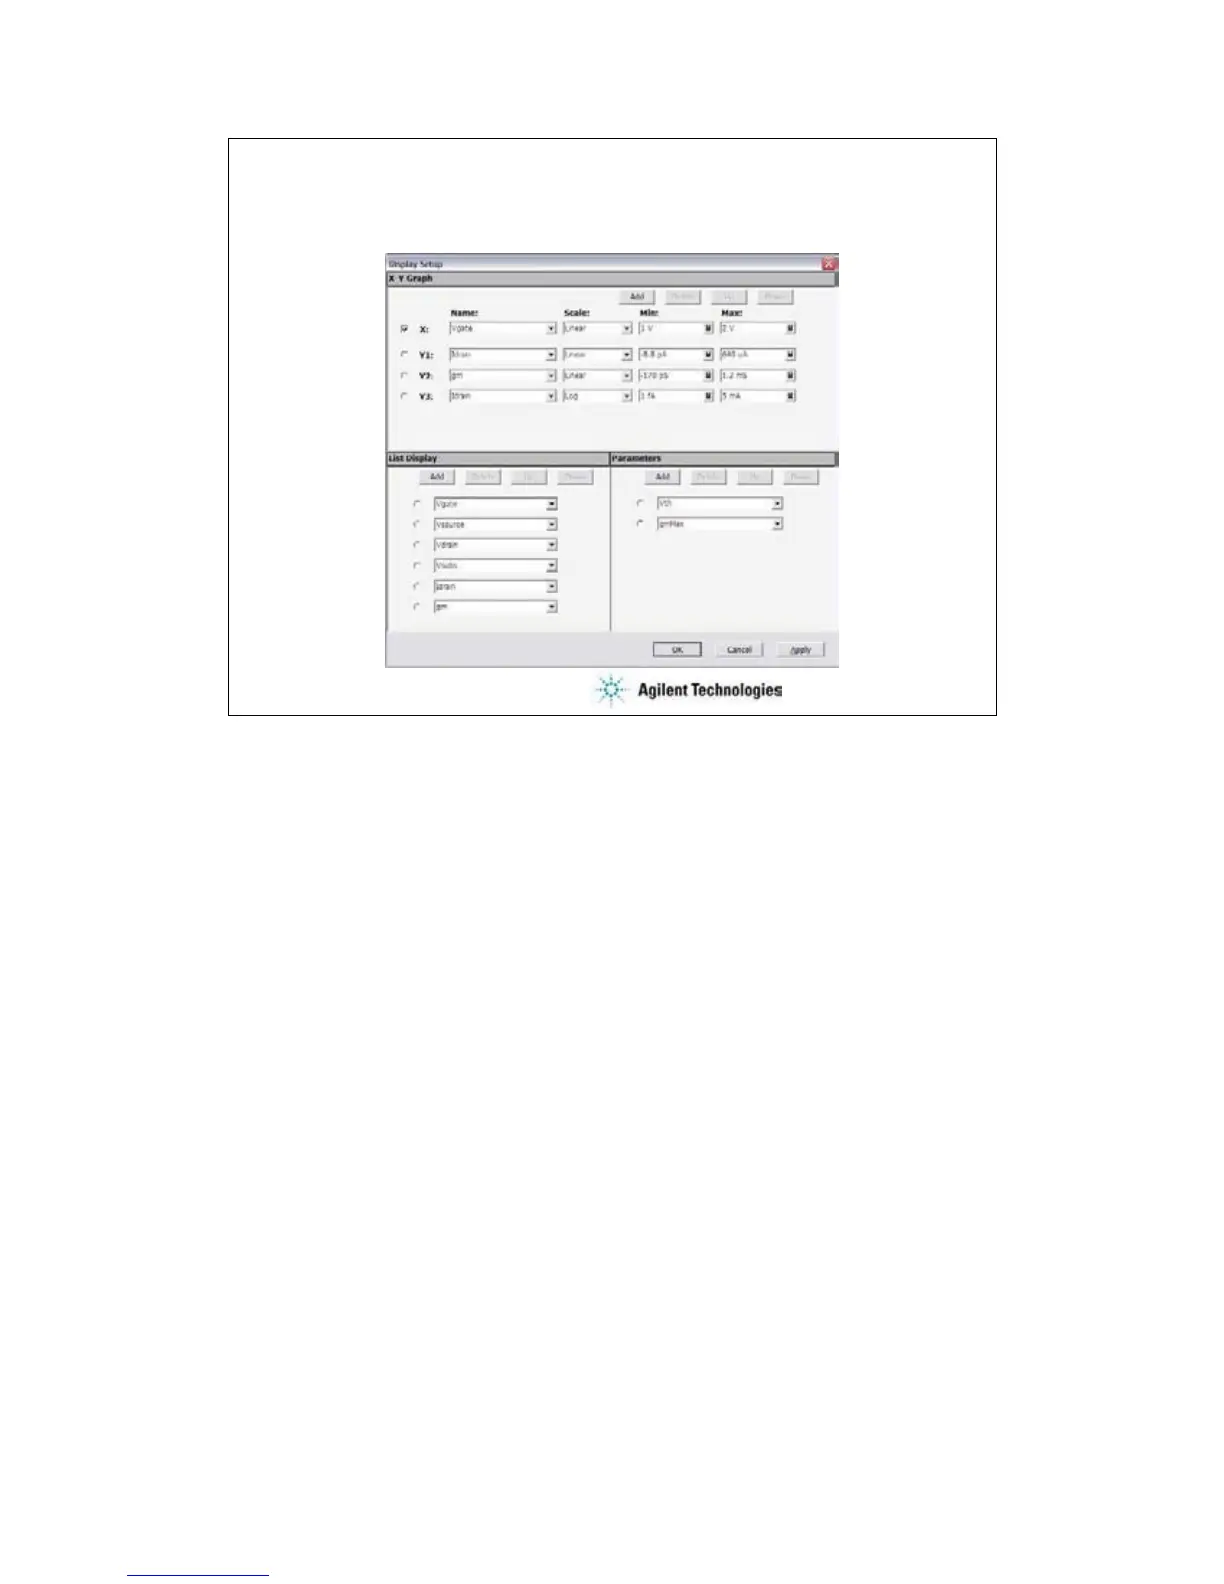
To Change Display Setup
View > Display Setup…
This dialog box is used to change the graph scale and data displayed in the Data Display window.
The X-Y Graph area sets the X axis and Y axis of the X-Y Graph Plot area.
•Name: Name of variable to plot on the X axis
•Scale: Linear or Log
•Min: Minimum value of the specified axis
•Max: Maximum value of the specified axis
The List Display area selects the variables to be listed in the List Display area. Up to 20 variables
can be set.
The Parameters area selects the variables to be listed in the Parameters area. Up to 20
parameters can be set.
 Loading...