©2019 ALL-TEST Pro, LLC All Rights Reserved 30 Rev 06/20/2019
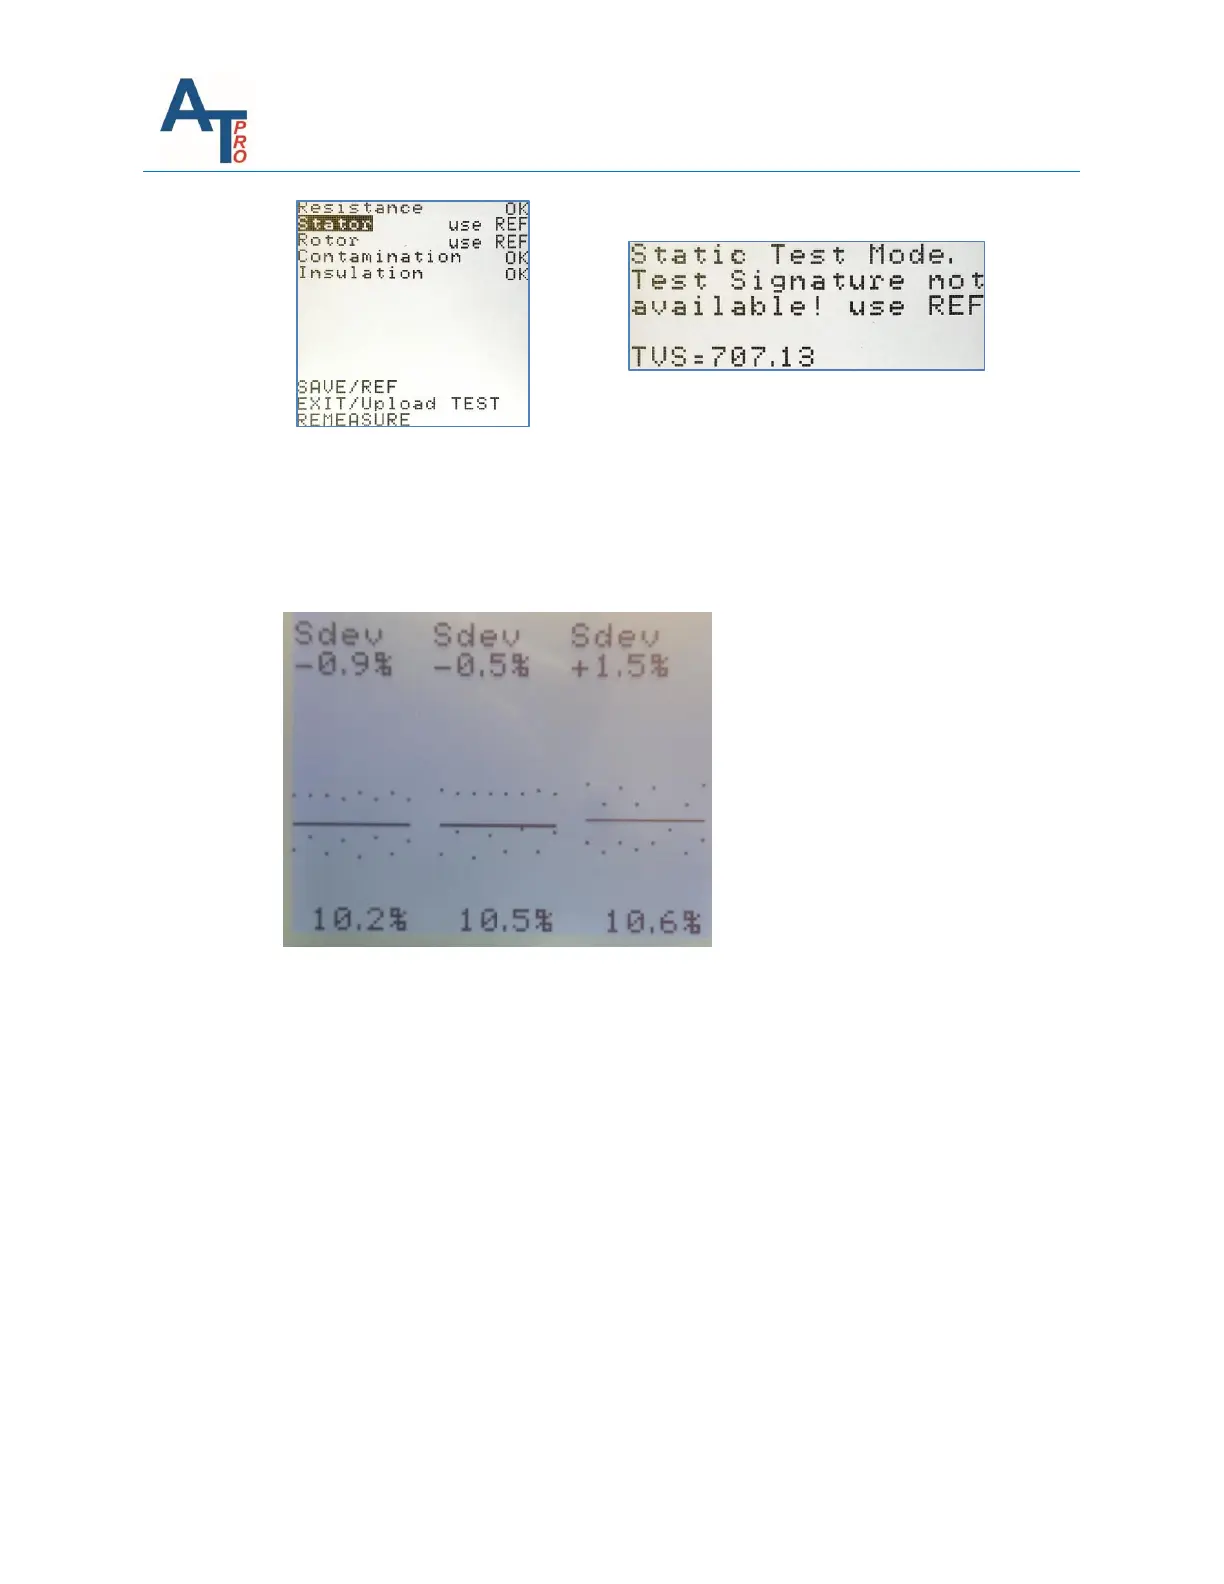
The following is an example whey dynamic test is performed and Stator is selected. The center
solid line in the graph is the Stator signature and Sdev represents the deviation of the stator
signature. Evidently, for the last measurement of Phase 1-3, the stator signature is higher than
the other two measurements which will provides a WARN alarm since 1.5% exceeds the WARN
limit.
The six black dotted lines represent the Rotor Signature and include an upper and lower
signature. This represents the deviation of the peak values during rotation. As the output of the
instrument is sinusoidal and the response of the motor will be sinusoidal, there will be peak
values both positive and negative. There are 8 dots for each phase and if this were an 8-pole
motor then this represents 1 full revolution of the motor shaft. If this were a 2-pole motor, then
it represents 4 revolutions of the motor shaft. If this were a 12-pole motor, then it represents ¾
of a revolution of the motor shaft. With this Rotor signature there is a slight variation in the
distribution of the peak values, but as they are within our limit, this rotor is in good condition.
The % change displayed on the bottom represents the change in impedance during rotation of
the shaft.