Chapter 3 — T-Series Tracking Generator 3-3 Measurement Example
Tracking Generator MG PN: 10580-00339 Rev. C 3-3
7. When measuring a filter with a very high insertion loss in the stop band, press the Shift
key, then the Trace (5) key. Press the Trace A Operations submenu key, then the
Average → A submenu key to turn on averaging and clean up the stop band area. An
averaging value of 10 will probably be adequate for most filters.
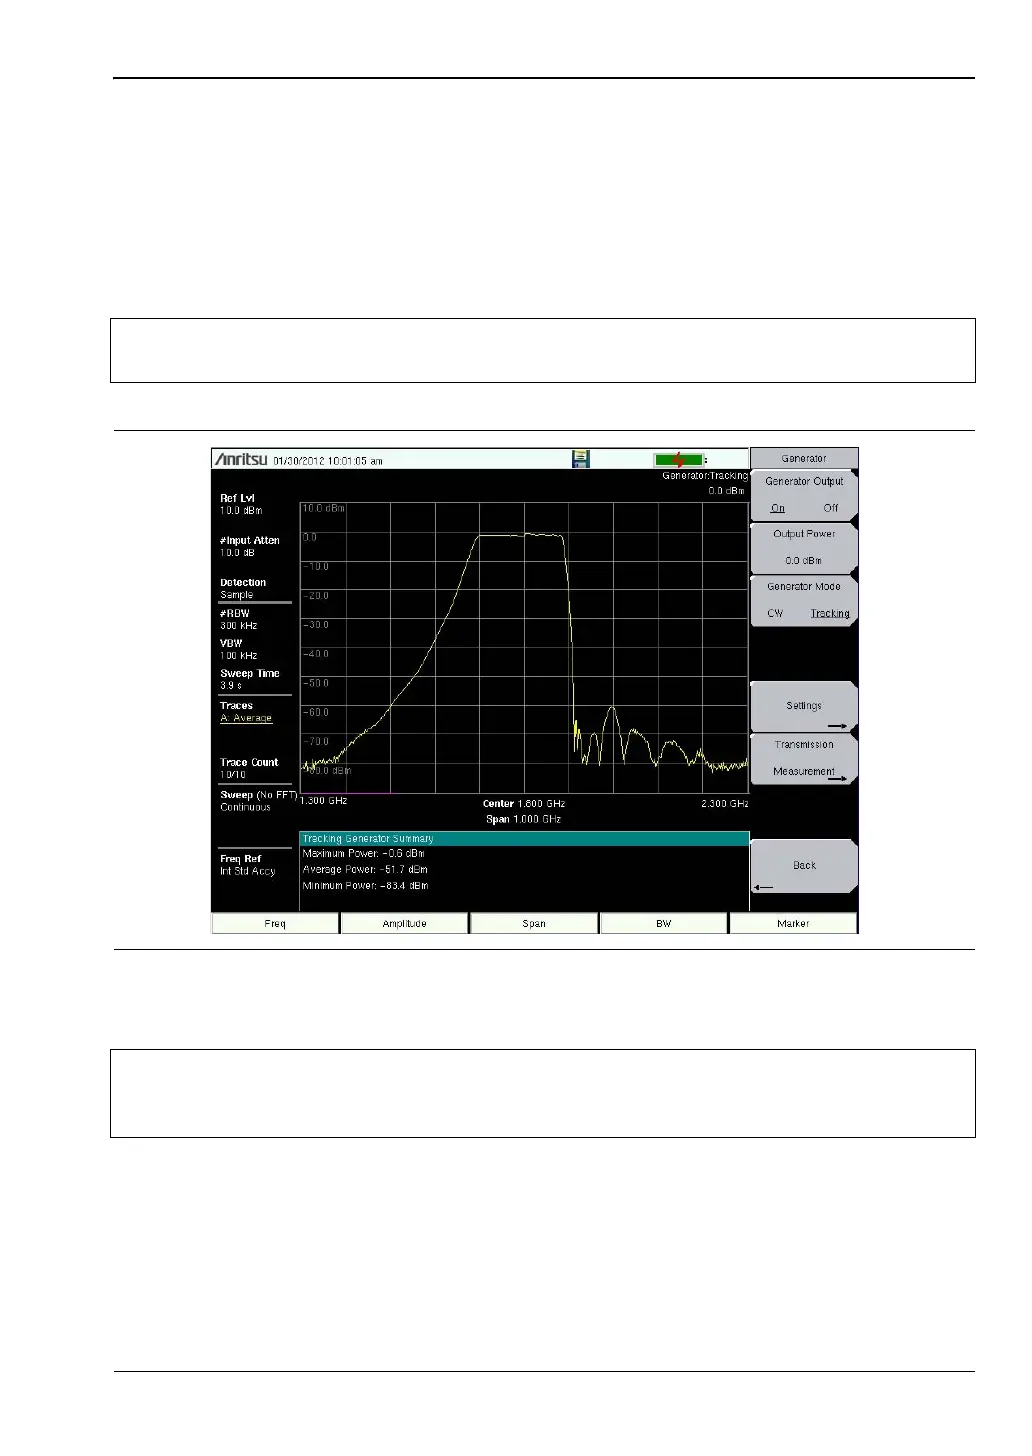
8. Under the Setting submenu turn Power Statistics On (Figure 3-2) to display the spectrum
analyzer received Maximum, Average, and Minimum power of each frequency range
sweep.
Note
If the noise floor drops below the visible display, then set the Scale dB/division
setting to a value larger than 10. This will increase the displayed amplitude range.
Figure 3-2. Increasing Measurement Dynamic Range, Trace Averaging On, Displaying Power
Statistics
Note
Many of displayed settings on the left side of the screen are used as menu
shortcuts. Select a parameter by touching the appropriate setting on the touch
screen to display the menu and set up the parameter for editing.
ООО "Техэнком" Контрольно-измерительные приборы и оборудование www.tehencom.com
 Loading...