48
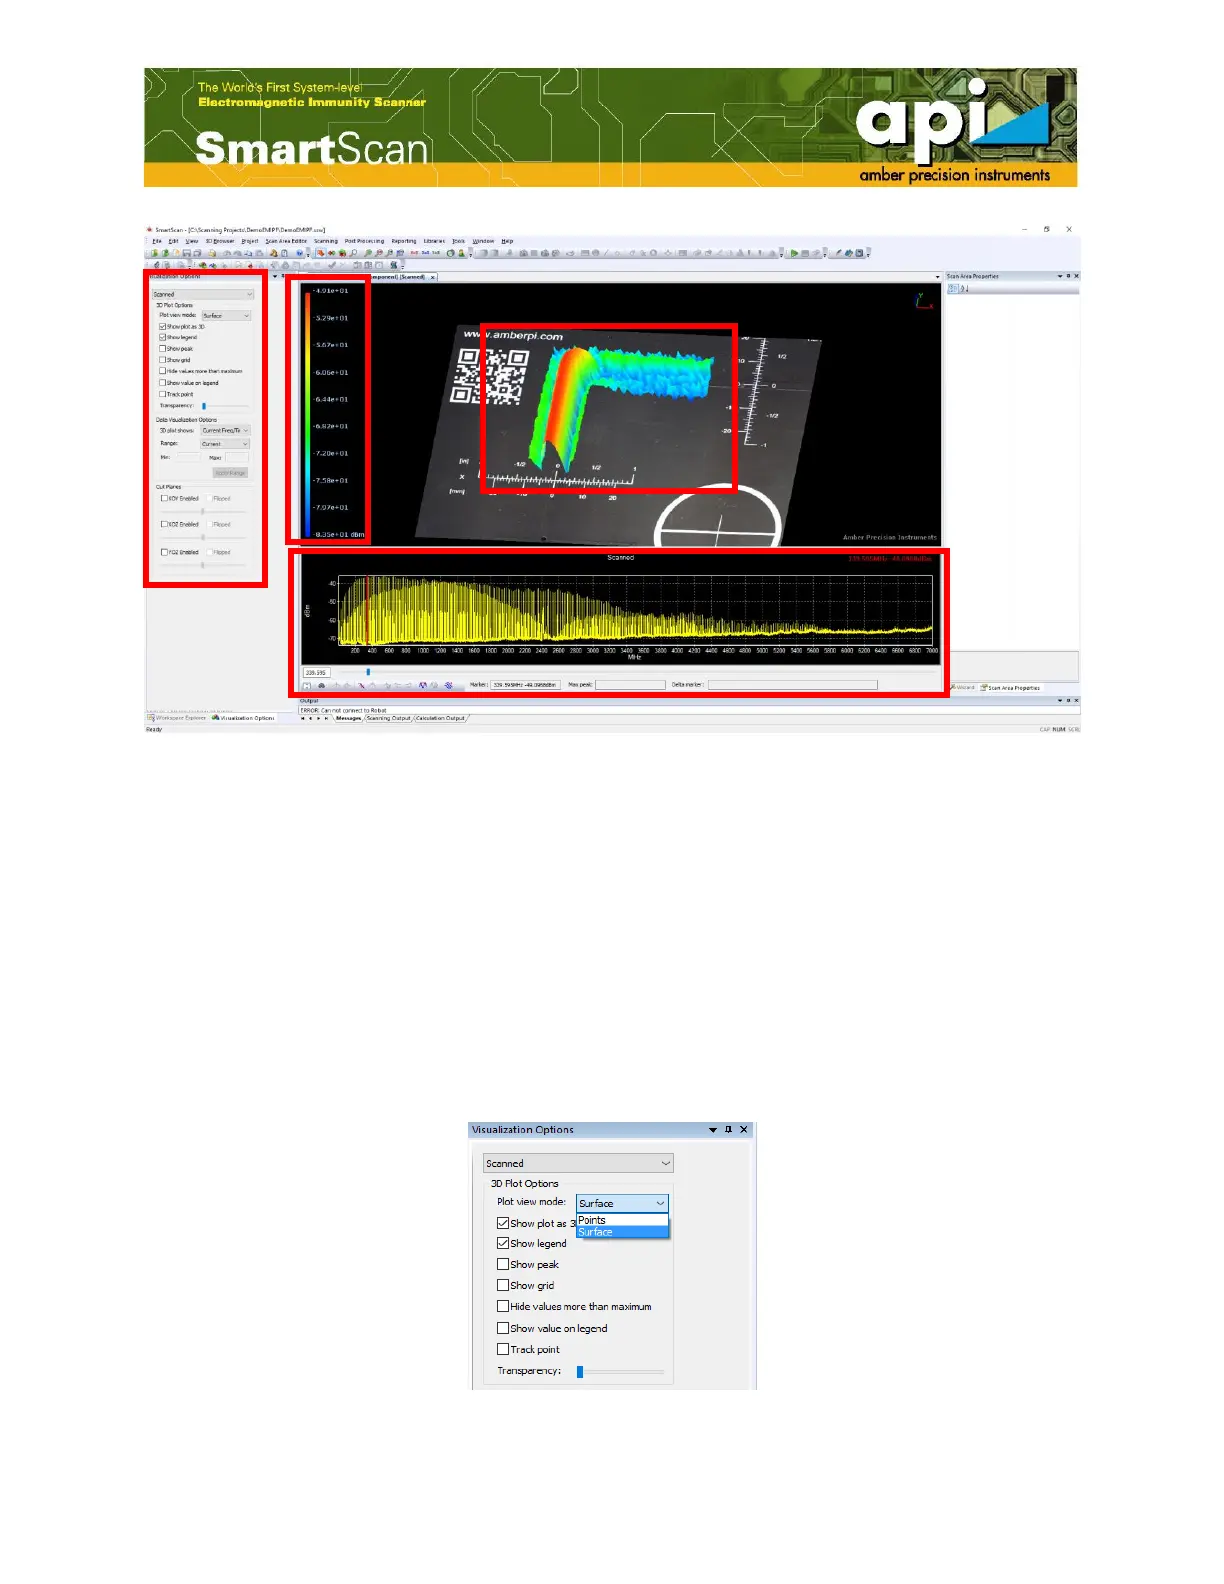
Figure 78: Scan result visualization.
5.1. 3D Plot Options
5.1.1. Selecting a Plot Type
Magnitudes of amplitude are displayed as various colors in data plots. Two types of plotting are
available in SmartScan software: "Points" and "Surface".
In "Points" mode, the amplitude at a single probing position is represented by a discret dot with a
specific color. While in surface mode, the amplitude of emission is displayed in a single plane
that forms a continuous surface with a smooth variation of colors over the scan area. Colors
range from blue, the lowest amplitude, to red which represents the highest amplitude of emission.
Figure 79: Select a plot type.