56
5.2.2. 3D Plot Range
Three options are available for the range of data plotted: "current", "absolute" and "custom".
Figure 95: 3D plot range.
"Current" mode displayscolor map of scanned data in a way that the scale of the color map sorted
from the minimum value measuredat the selected particular frequencyto the maximum value
measured at the selected particular frequency.
"Absolute"mode displays color map of scanned data in a way that the scale of the color map
sorted from the minimum amplitude collected among entire frequency rangeto the maximum
amplitude collected among entire frequency range.
"Custom"mode allows the user to enter the minimum and maximum values of magnitude in
order to focus on a specific range.
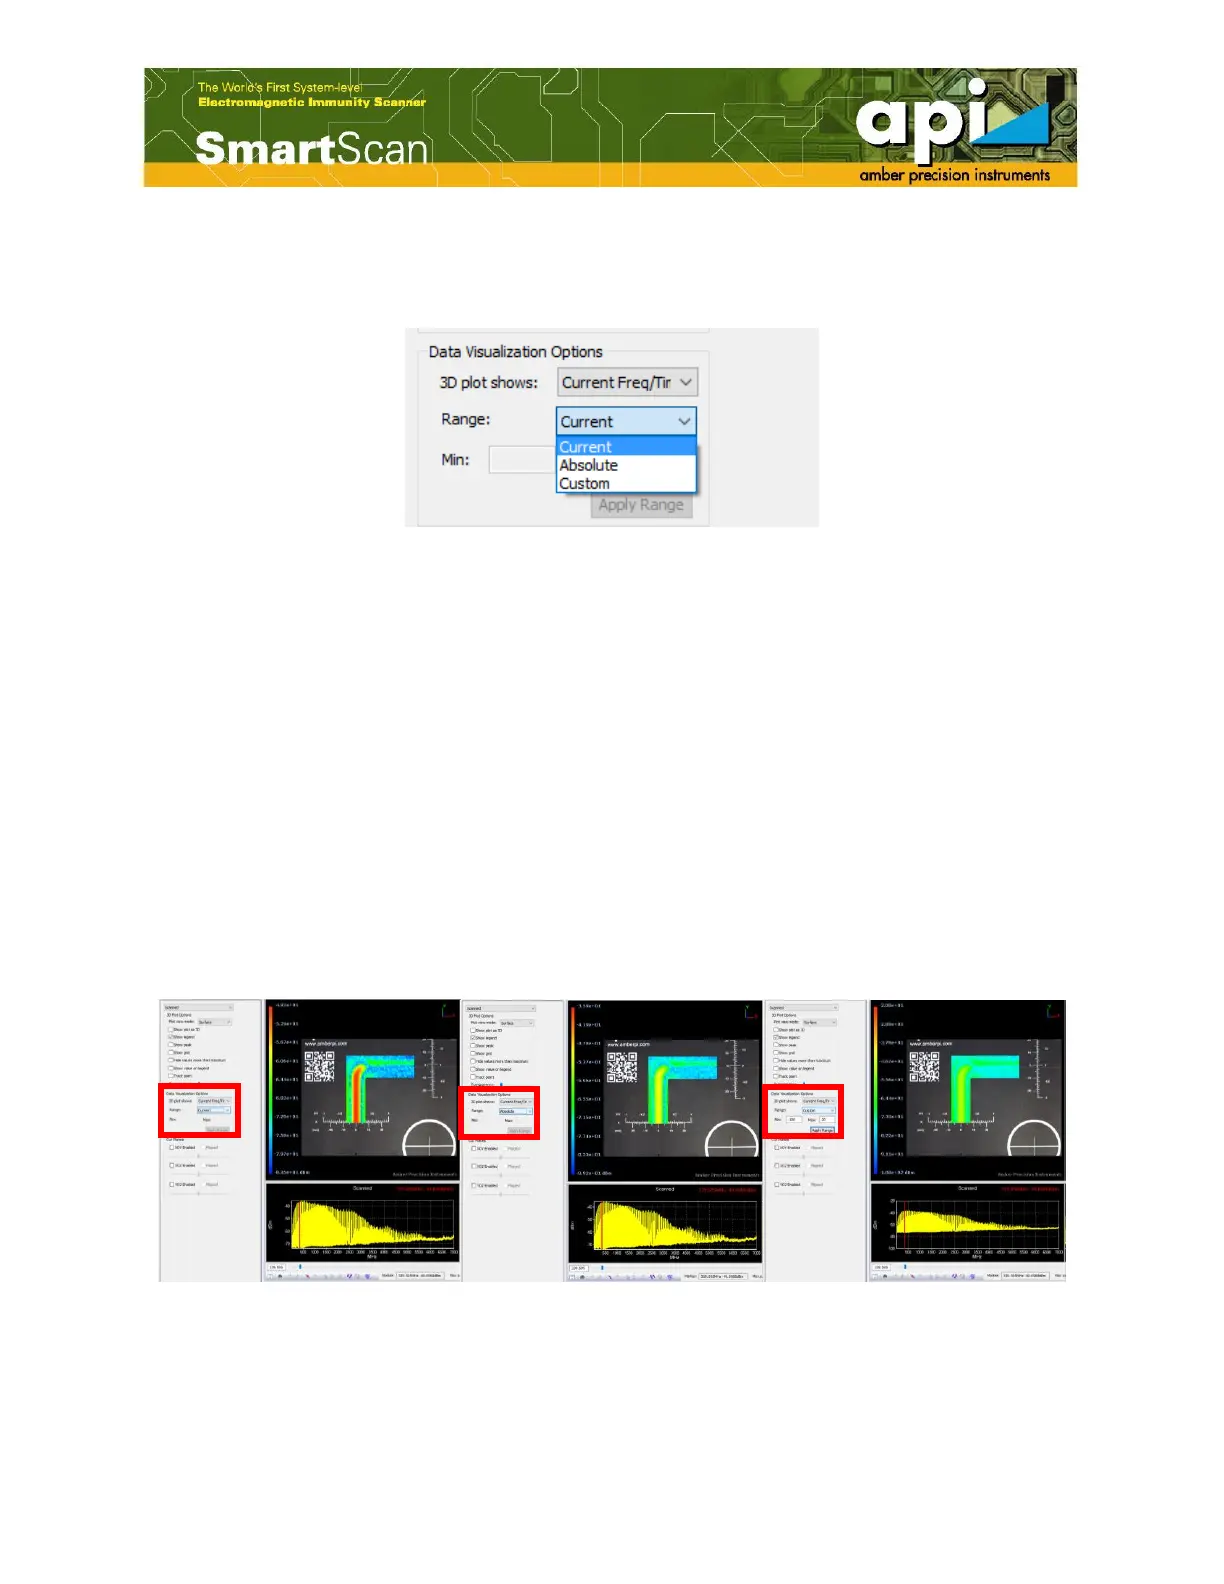
An example of three color maps displaying in three different options is shown in Figure 96. All
other settings of displayed data maintains the same, only the 3D plot range has been modified in
the following example.
Figure 96: 3D plot range example of "Current" (left), "Absolute" (middle) and "Custom" (right).
5.3. Cut Planes Option