58
YOZ
When YOZ is enabled, as the scroll bar moves from left to right, the data plot appears from left
to right in X direction. Check "Flipped" to reverse the data plot appear direction.
Figure 100: YOZ cut plane option.
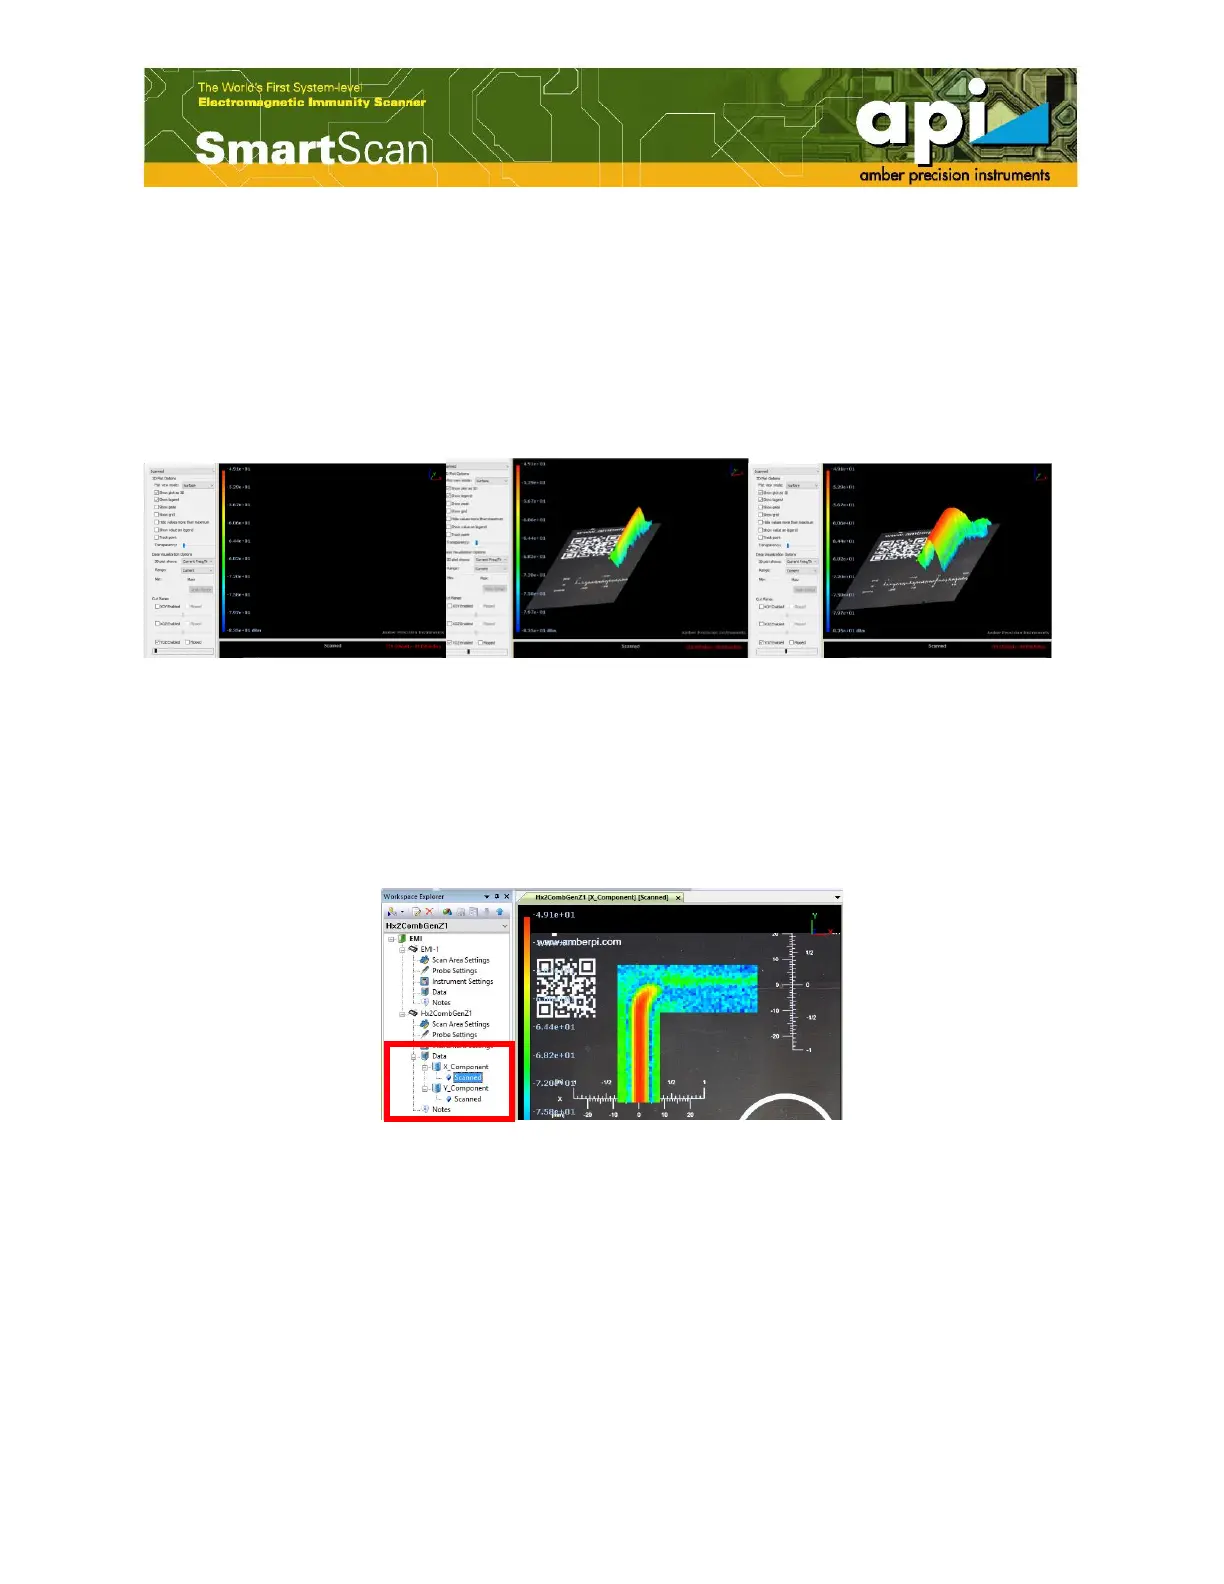
5.4. Data Selection
The user can define which components of the field are displayed in the graphics area by selecting
the "X_Component" or "Y_Component" in the workspace explorer under the "Project" name
shown in Figure 101
Figure 101: Select components.
The magnitude can be displayed by opening the "Merge Data" window which can be accessed
through the "Post Processing" button on the top menu bar of the SmartScan window.