53
Figure 90: Show grid example.
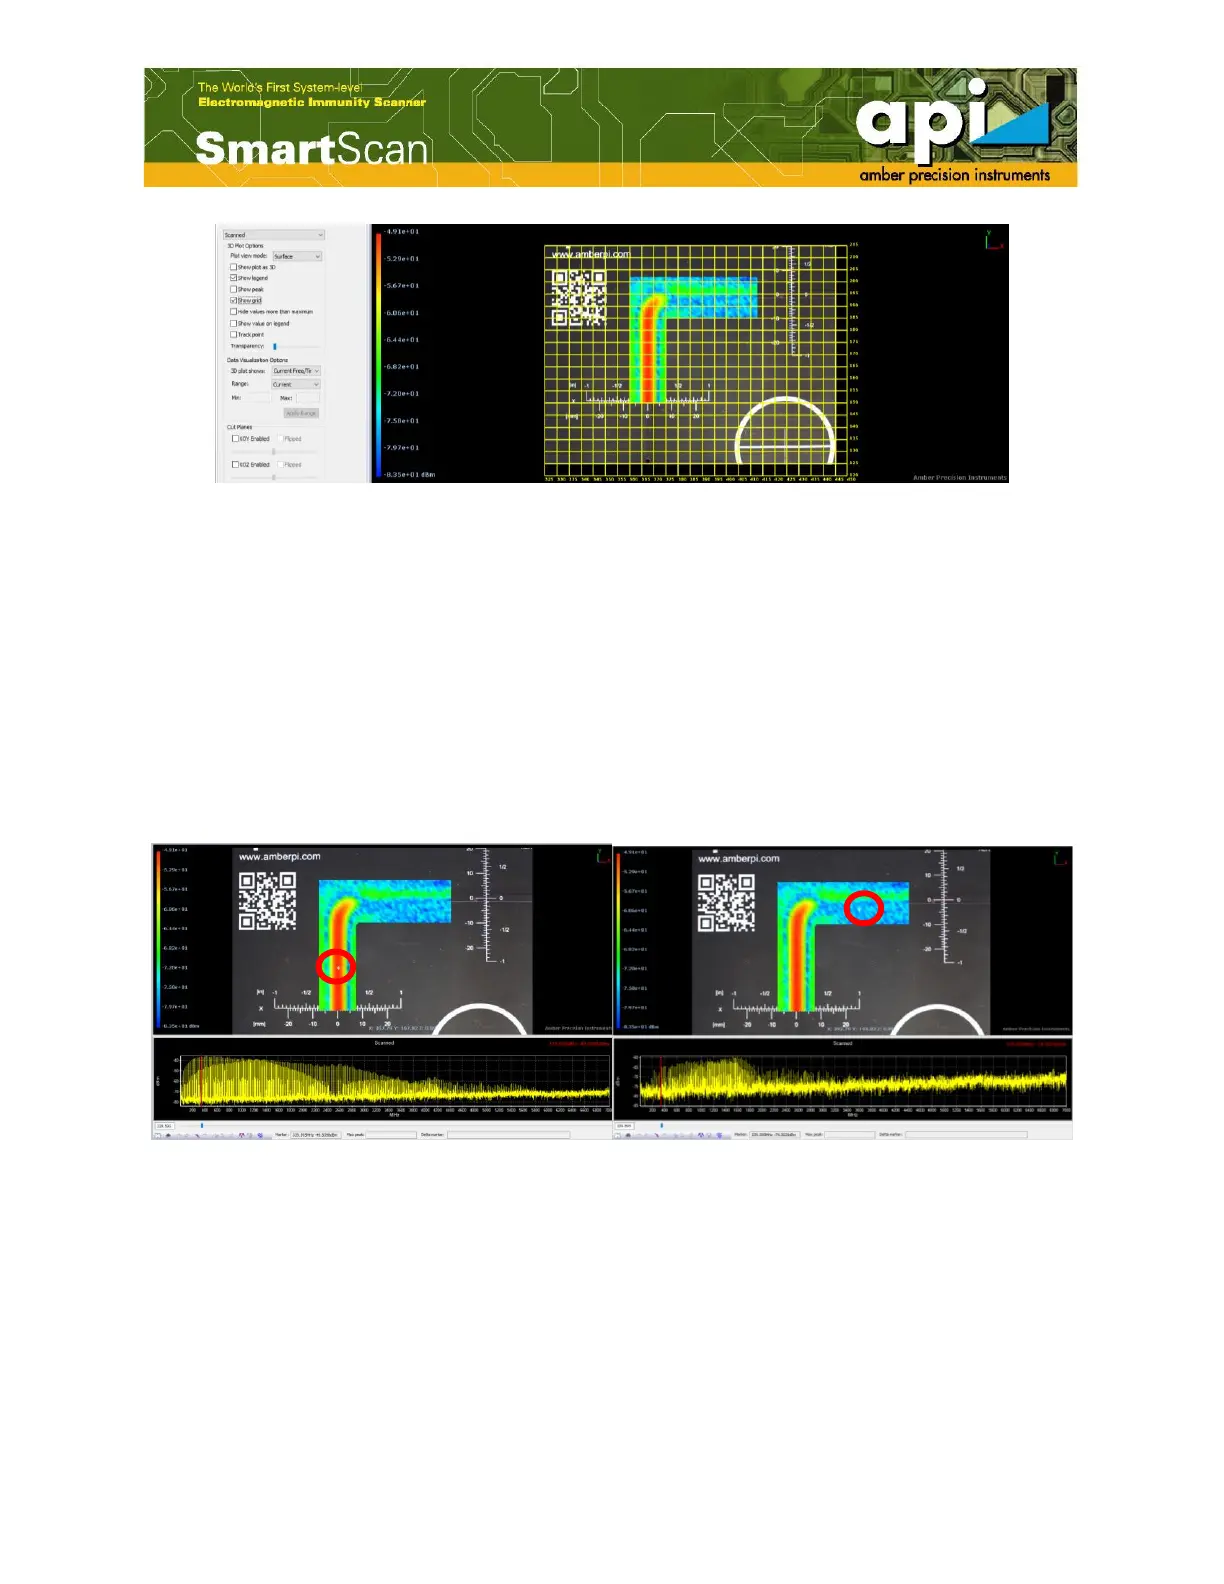
5.1.5. Track Point
"Track point" function allows the user to check the frequency response of selected points. When
placing the mouse pointer above scanned points, the graph below the color map updates each
point’s frequency response.
When enable "Show value on legend" function along with "Track point" function, the magnitude
of chosen point at a selected frequency is shown in the legend chart.
Figure 91: Track point example.