54
Figure 92: "Track point" with "Show value on legend" example.
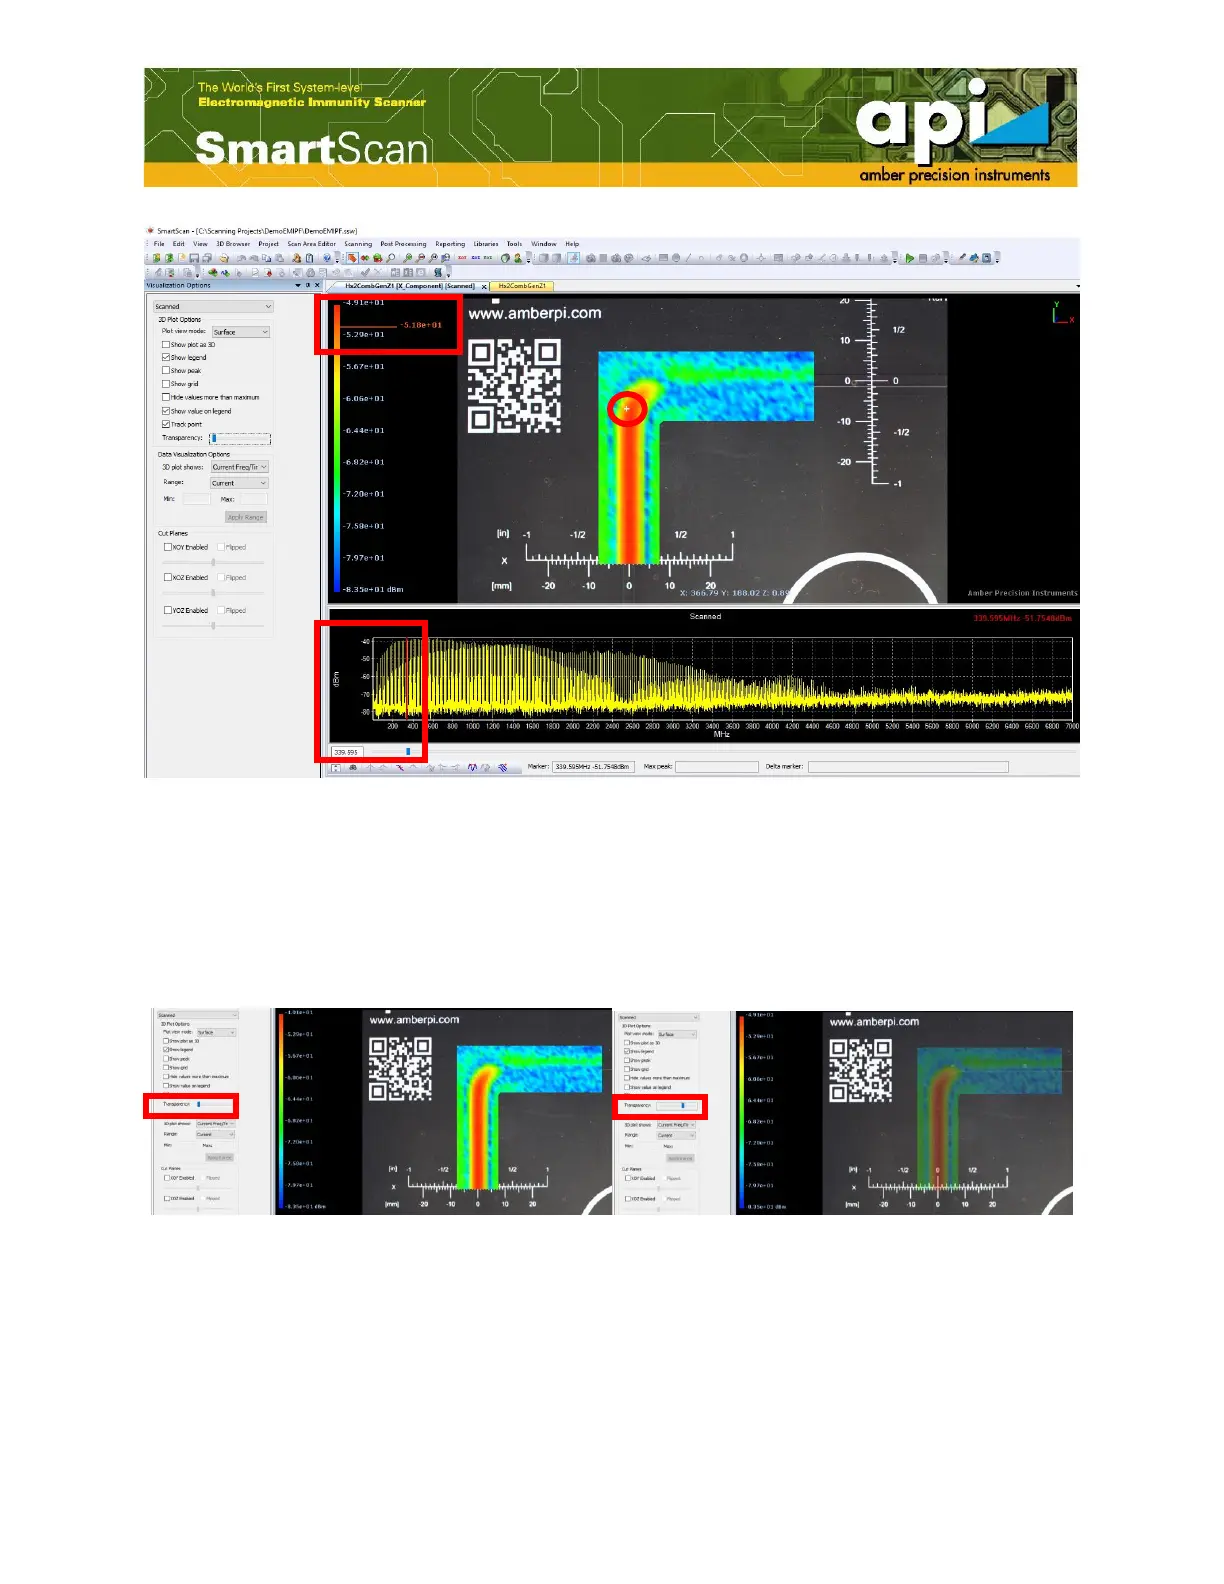
5.1.6. Transparency of Data Plots
To change transparency of data plots over the background DUT picture, the user can adjust the
"Transparency" scroll bar. An example of a surface with enhanced transparency is shown
inFigure 93.
Figure 93: Change transparency of data plots.
5.2. Data Visualization Options
5.2.1. 3D Plot Display Options