DRAFT
September 25, 2007 1:07 am, 4376782_Standalone_Installation.fm
Chapter 4 Install the Standalone Layout
Perform the RNase P Experiment
61
Applied Biosystems StepOne
™
and StepOnePlus
™
Real-Time PCR Systems
Installation, Networking, and Maintenance Guide
Notes
After the run, the StepOne
™
software:
1. Generates a standard curve from the averaged threshold cycle (C
T
) values of the
replicate groups of standards.
2. Calculates the concentration of the two unknown populations using the standard
curve.
3. Calculates the following to assess the instrument performance:
where:
• CopyUnk
1
= Average copy number of unknown #1 (5,000-copy population)
• σ
CopyUnk1
= Standard deviation of unknown #1 (5,000-copy population)
• CopyUnk
2
= Average copy number of unknown #2 (10,000-copy population)
• σ
CopyUnk2
= Standard deviation of unknown #2 (10,000-copy population)
Installation Specification
The instrument passes the RNase P experiment if the inequality holds and the instrument
successfully distinguishes between 5,000 and 10,000 copies with greater than 99.7%
confidence.
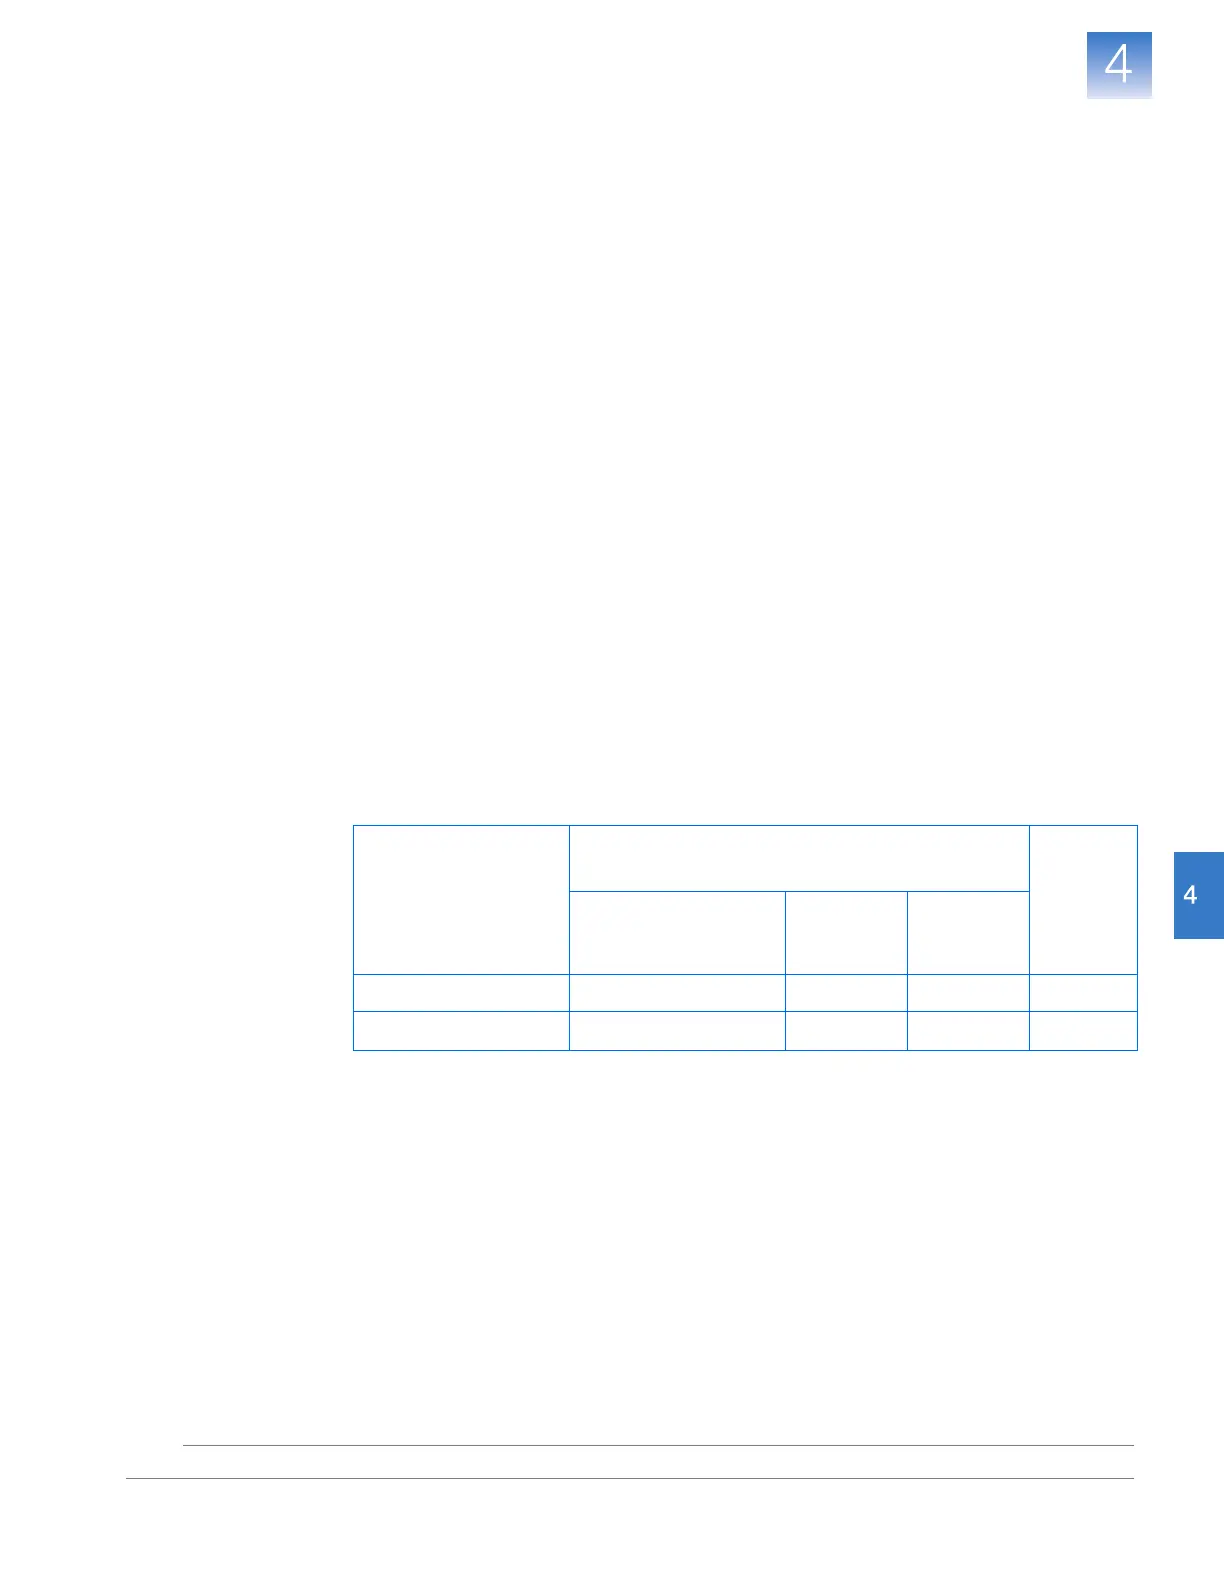
To meet the installation specification, you can omit a limited number of outlier wells
from the 5,000- and 10,000-copy unknown populations. The number of wells that you
can remove depends on the instrument that you are installing.
Instrument
Maximum number of outlier wells that can be
removed from each…
Tot al
Unknown Population Standard
Negative
Controls
(NC)
StepOnePlus
™
System 6 0 0 12
StepOne
™
System 2 0 0 4
CopyUnk
2
()3 σ
CopyUnk2
()–[]CopyUnk
1
()3 σ
CopyUnk1
()+[]>