SECTION 3 OPERATING THE A-2000
______________________________________________________________________
3-7
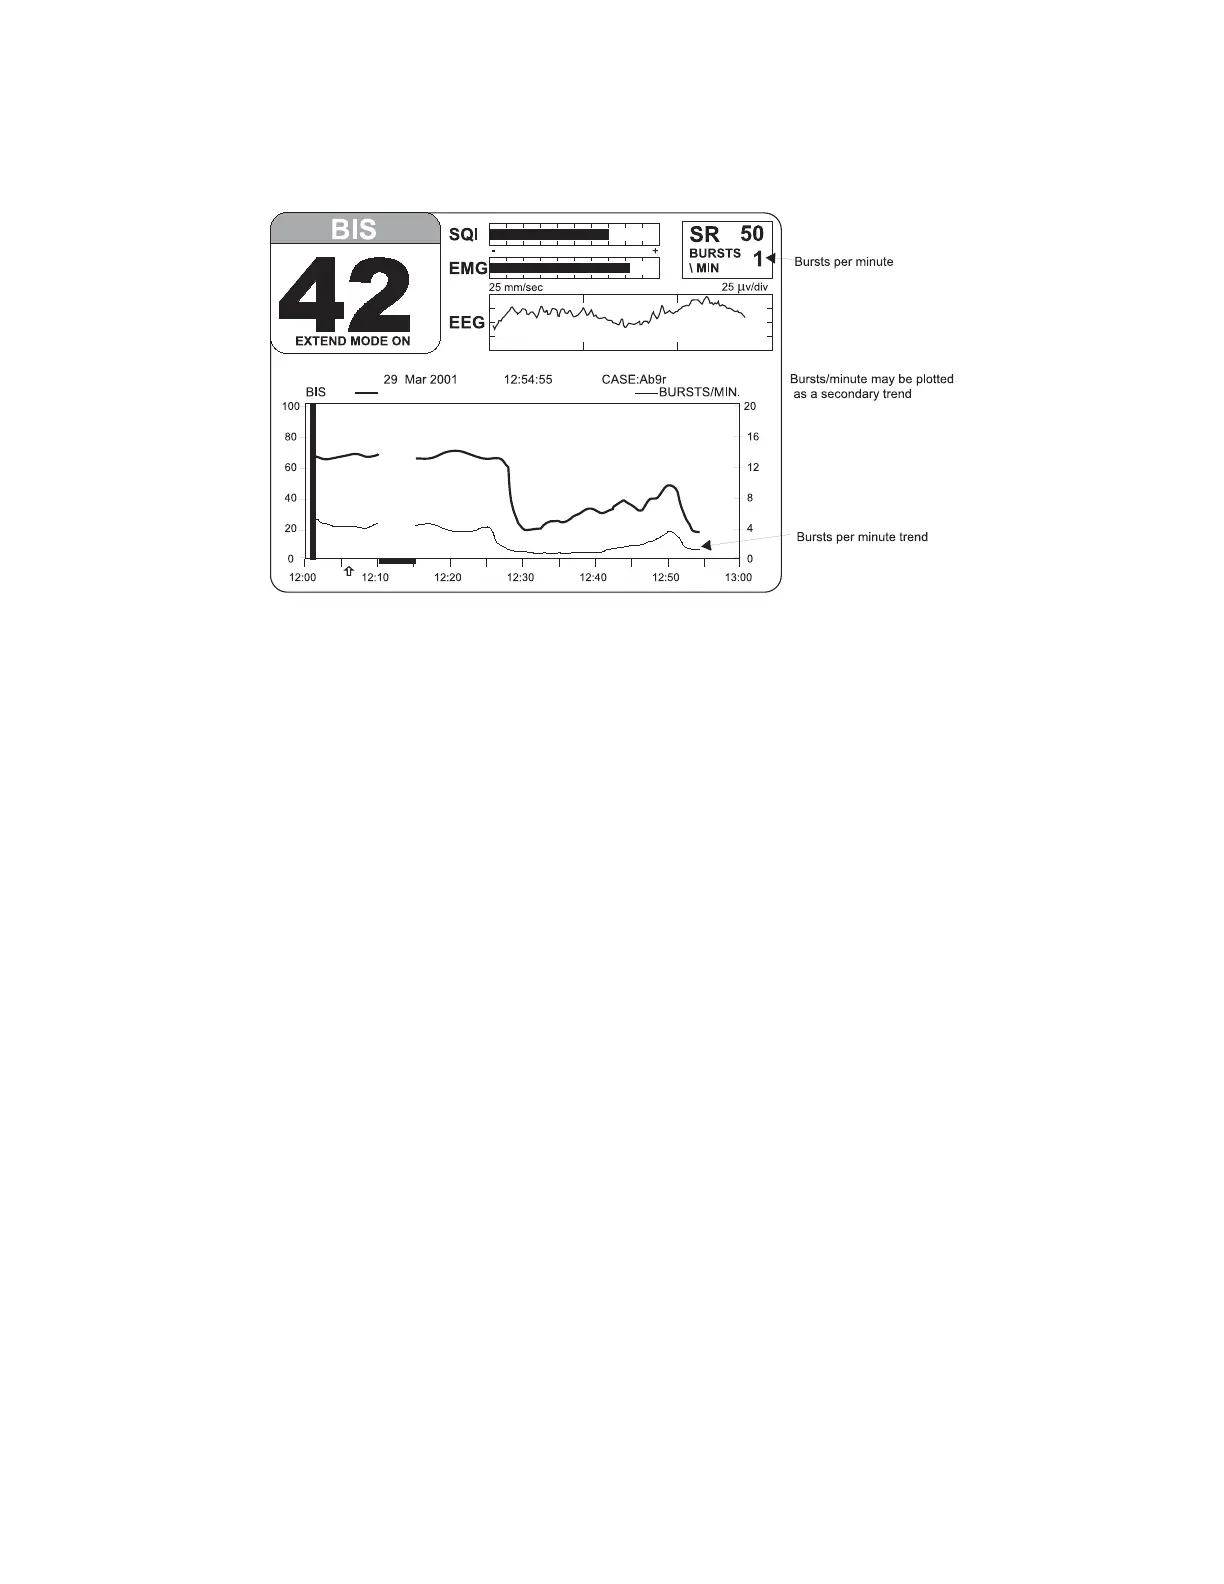
Figure 12 The BIS Trend Display with BIS Extend Sensor in Use
3.3.3 The Message Region
The Message Region is a space reserved for text that appears below the BIS and Signal
Quality Regions and extends the full width of the screen. Status and error messages are
displayed here. Specific error messages are explained in the Troubleshooting section of
this manual.
3.3.4 Graphic Display Region
The Graphic Display Region displays trend graphs of the BIS and an optional secondary
variable. During the sensor check procedure, this region of the screen is used to issue
instructions and report current status.
The BIS Trend display shows a plot of the Bispectral Index over a 1-hour time period.
The BIS trend is indicated with a thick line and its unit markings appear on the left axis.
The name BIS is displayed above the left corner of the graph (Figures 12,13).
A secondary variable may be added to the display by selecting "SR", "EMG," or "SQI" in
the Advanced Setup Menu. When a BIS Extend sensor is in use, you may select Burst
Count (“Bursts/Min”). See Section 3.4.2 for instructions on selecting a secondary
variable. The secondary trend is shown with a thin line and its unit markings appear on
the right axis. The secondary trend name is displayed above the right corner of the
graph.
A thick vertical bar marks the start of a case at the time a new case is detected. A
similar bar appears at the end of a case when in Review Mode or on the printer output.
The monitor assumes that a case has ended if the DSC, the PIC or the sensor have
been disconnected for more than 15 minutes, or if the monitor has been turned off, then
on.