SECTION 3 OPERATING THE A-2000
______________________________________________________________________
3-22
3.5 ALTERNATIVE DISPLAYS
Alternative screen displays can be requested in the Setup Menu. These displays are:
DSA, EEG and BIS Log.
4242
BIS
SQI
EMG
EEG
SR
50
25 mm/sec
25
μ
v/div
-
+
29 Mar 2001 13:01:52 CASE:Ab9r
SEF: 17.2
010 2030
AMPL
12:57
12:58
12:59
13:00
13:01
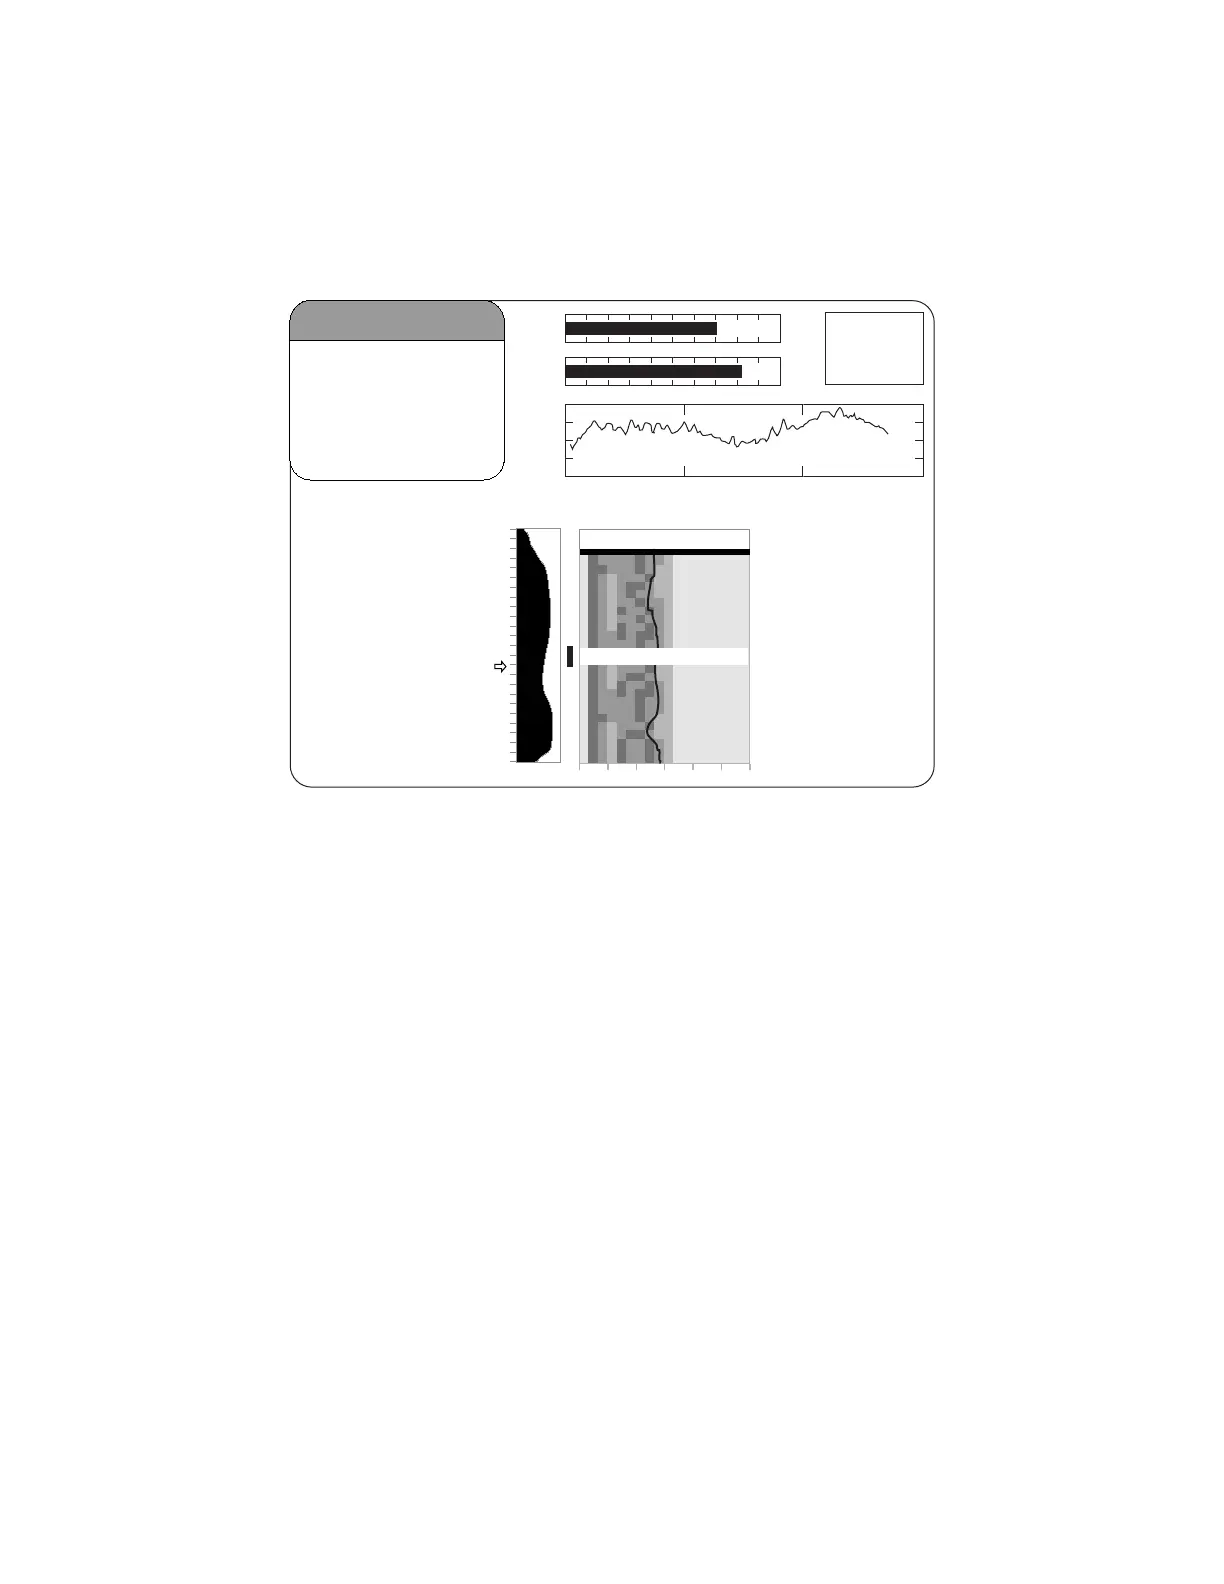
Figure 20 The Density Spectral Array (DSA) Display
3.5.1 The DSA Display:
The Density Spectral Array is displayed in the Graphic Display Region if the user has
selected "Display Type DSA" in the Setup Menu.
Density Spectral Array (DSA) shows changes in the power spectrum distribution over
time. The DSA is plotted using absolute spectra with a power scale of 0.0625 - 4 µV.
The frequency scale is shown on the horizontal axis with a range from 0 - 30 Hz.
A 95% spectral edge marker (actually three vertical lines: white/black/white) is
superimposed on the DSA spectra and the current spectral edge frequency value
(SEF) appears above the total power graph.
A graph of total power, indicating the strength of the signal based on a decibel (dB)
scale, is shown beside the DSA and is labeled "AMPL"(amplitude).
A thick horizontal bar marks the start of a case at the time a new case is detected. A
similar bar appears at the end of a case on the printer output. The monitor assumes
that a case has ended if the DSC, the PIC, or the sensor have been disconnected for
more than 10 minutes, or if the monitor has been turned off, then on.