SECTION 3 OPERATING THE A-2000
______________________________________________________________________
3-24
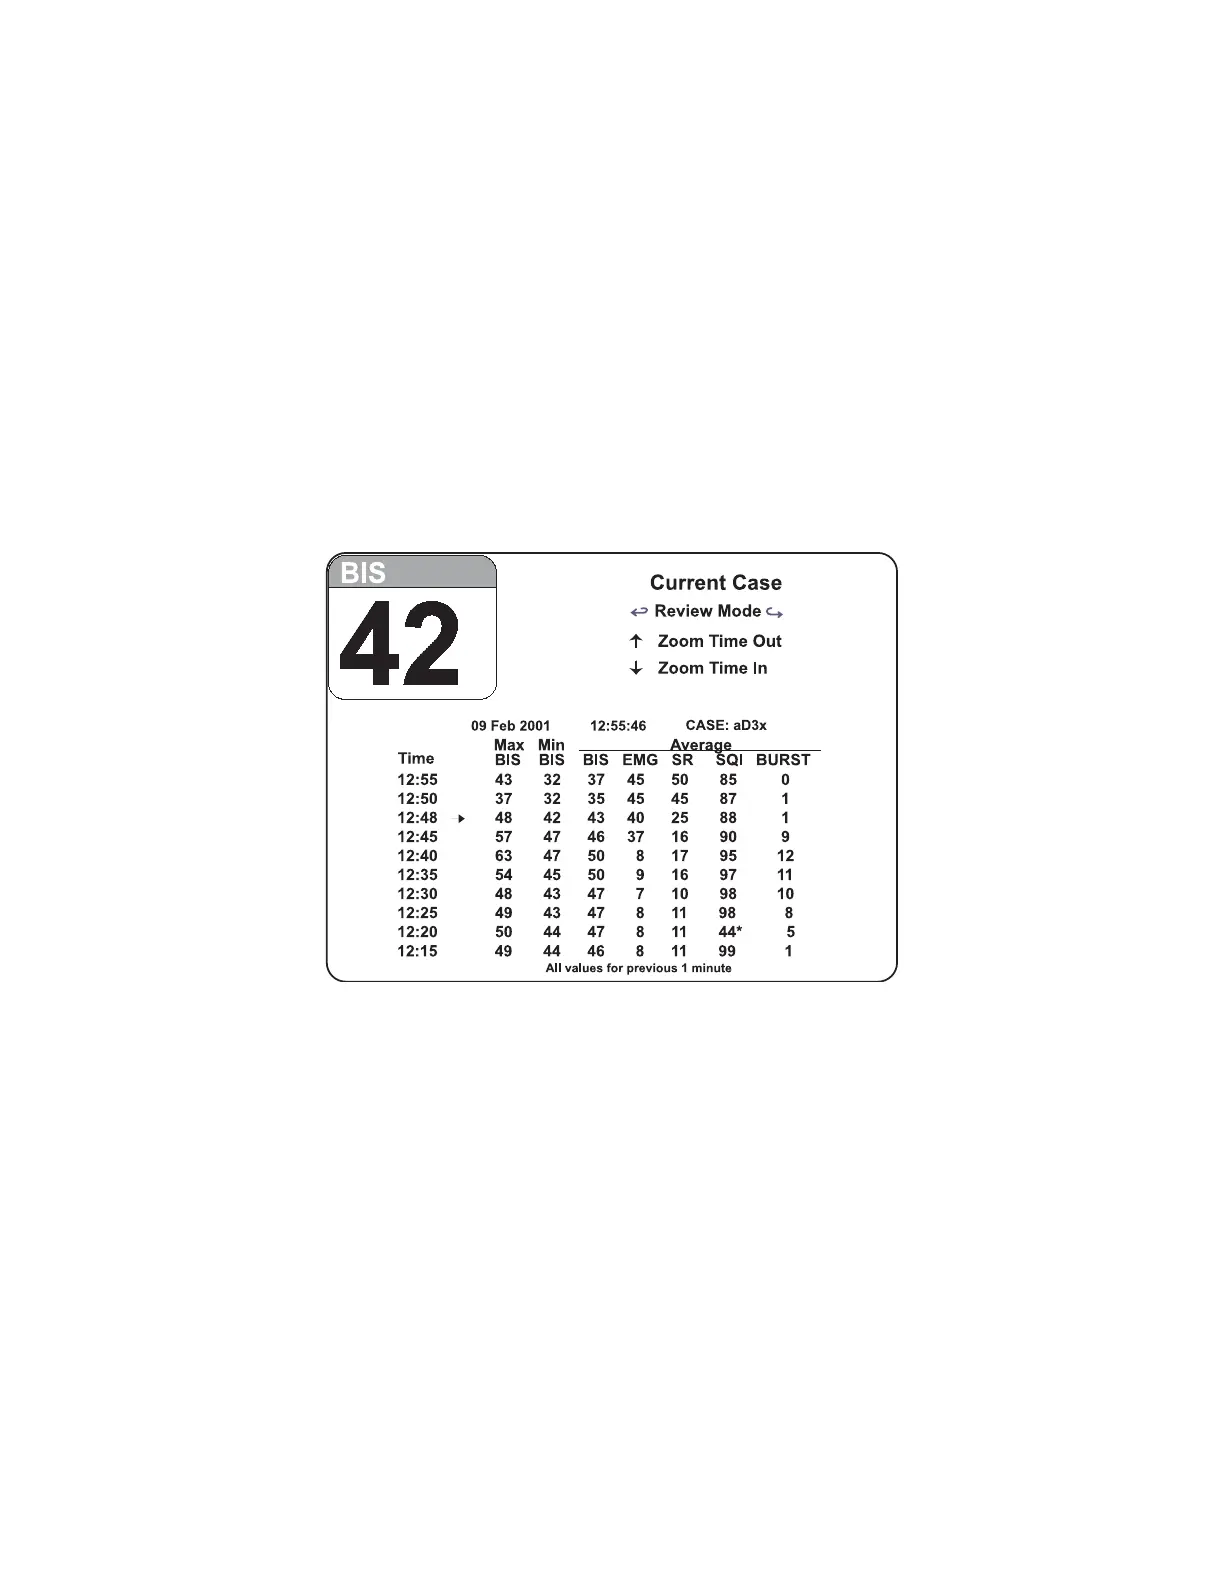
3.5.3 The BIS Log Display
This display shows the BIS numeric values over time (up to 400 hours) and is updated
continually as each value is calculated. Each line shows a one-minute sample of the
minimum and maximum BIS values along with the average BIS, EMG, SR (Suppression
Ratio), SQI (Signal Quality Index), and BURST (Burst Count) values during the previous
one-minute period. Event markers (arrows) display when an event is noted. When
signal quality is very low, BIS, SR and Burst Count values are not reported. Note that
Burst Count is available only when a BIS Extend sensor is in use.
The time interval at which the BIS is reported can be set to 1, 5, 15, or 60 minutes in the
Display Parameter screen. A 1-minute interval is recommended for a complete picture
of the BIS over time.
Figure 22 The BIS Log Display – Current Case