F/T DAQ Installation and Operation Manual
Document #9610-05-1017-06
ATI Industrial Automation, 1031 Goodworth Drive, Apex, NC 27539 USA +1-919-772-0115 www.ati-ia.com
45
7.3 Compound Loading Ranges of F/T Sensors
The F/T sensor’s strain gauges are optimally placed to share information between the forces
and torques applied to the sensor. Because of this sharing, it is possible to saturate the
transducer with a complex load that has components below the rated load of the sensor.
However, this arrangement allows a greater sensing range and resolution.
These graphs may be used to estimate a sensor’s range under complex loading. Each page
represents one sensor body, with either English or Metric units. The top graph represents
combinations of forces in the x and/or y directions with torques about the z-axis. The bottom
graph represents combinations of z-axis forces with x- and/or y-axis torques. The graphs
contain several different calibrations, distinguished by line weight.
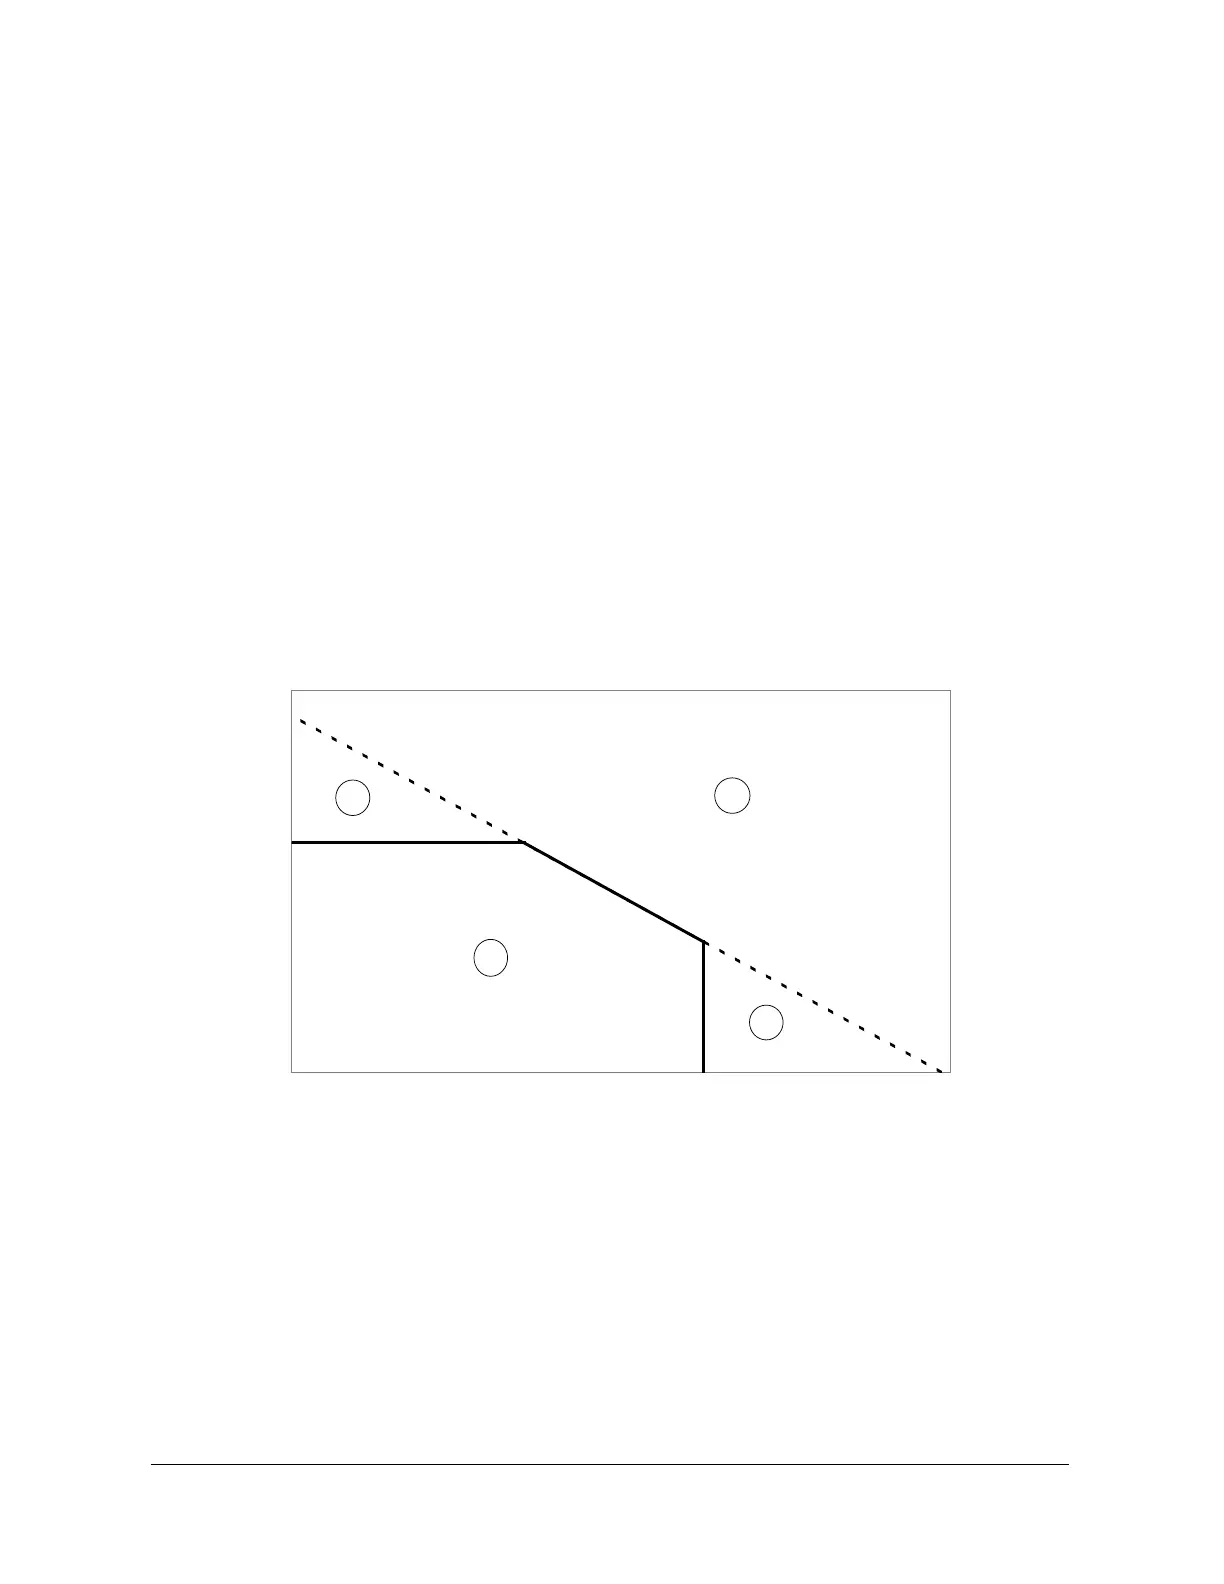
The following sample graph shows how operating ranges can change with complex loading.
The labels indicate the following regions:
A. Normal operating region. You can expect to achieve rated accuracy in this region.
B. Saturation region. Any load in this region will report a gauge saturation condition.
C. Extended operating region. In this region, the sensor will operate correctly, but the full-scale
accuracy is not guaranteed.
Sample Graph
Tz
Fxy
C
C
B
A