ATI Model F12/D Gas Transmitter Part 4 – Operation
61
O&M Manual (Rev-H)
Table 5. Data Log Special Codes
Sample unavailable (transmitter powered off, or sample not yet recorded)
Trouble alarm active at time of sample
Auto-test active at time of sample (if Log_Data=NO, see Auto-test Setup Options Menu)
Data is corrupted, or unreliable
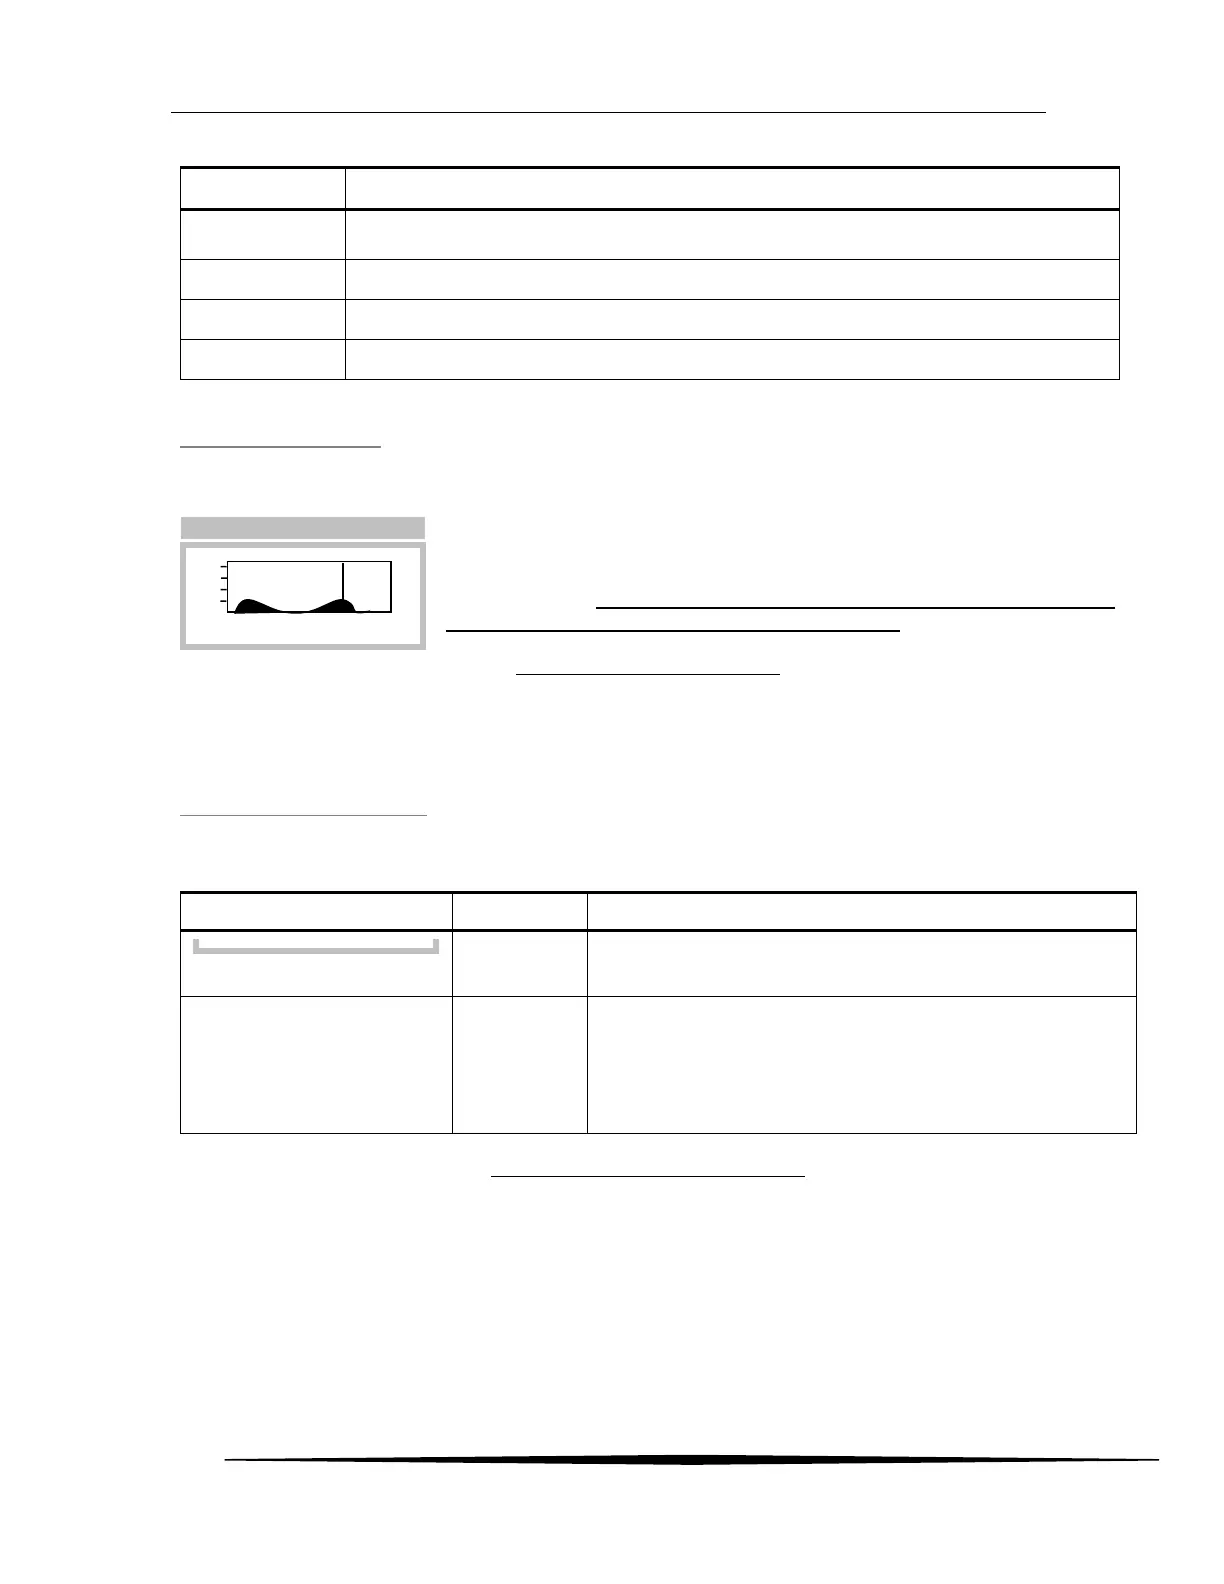
Data Log Graph View
The Graph view plots a sample as a vertical line, the height of which corresponds to the gas reading as a
percentage of the sensor’s range (ie, height = 100*reading/range). Samples are plotted from left (oldest)
to right (newest). On entry, a vertical cursor appears over the most recent
sample (or sample of interest), and the corresponding date, time, and gas
reading or special code (see above) are displayed on the lower line. These
values are updated as the cursor is moved left and right by pressing the up
and down keys. Note: the gas reading on the lower line is in the same units
that appear in the Main Display and Sensor menus.
Figure 77. Data Log Graph View
New data is not plotted while viewing the page. Pressing the Enter key presents the Data Log Menu
shown below, pressing the Esc key returns to the previous menu.
Data Log Graph View Menu
The Data Log Graph View Menu is appears by pressing the Enter key while viewing the Data Log Graph
View (above).
Figure 78. Data Log Graph View Menu
View single records (pseudo random-access selection) starting at
the cursor position.
Send a tabular ASCII report to the device connected to the COM
port (see Data Log Print on the next page). Note: only available
on transmitters with an RS232 or RS485 interface. The data log
must not be empty, and the COM protocol must be set to ASCII.
Otherwise, the transmitter will display an exception message.
…DataLog>View >Graph ,Enter