ATI Model F12/D Gas Transmitter Part 4 – Operation
62
O&M Manual (Rev-H)
Data Log Single View
The Data Log Single View Menu allows scrolling to an exact date and time for viewing a single sample.
Selecting Graph then presents the Graph view at the selected date and time.
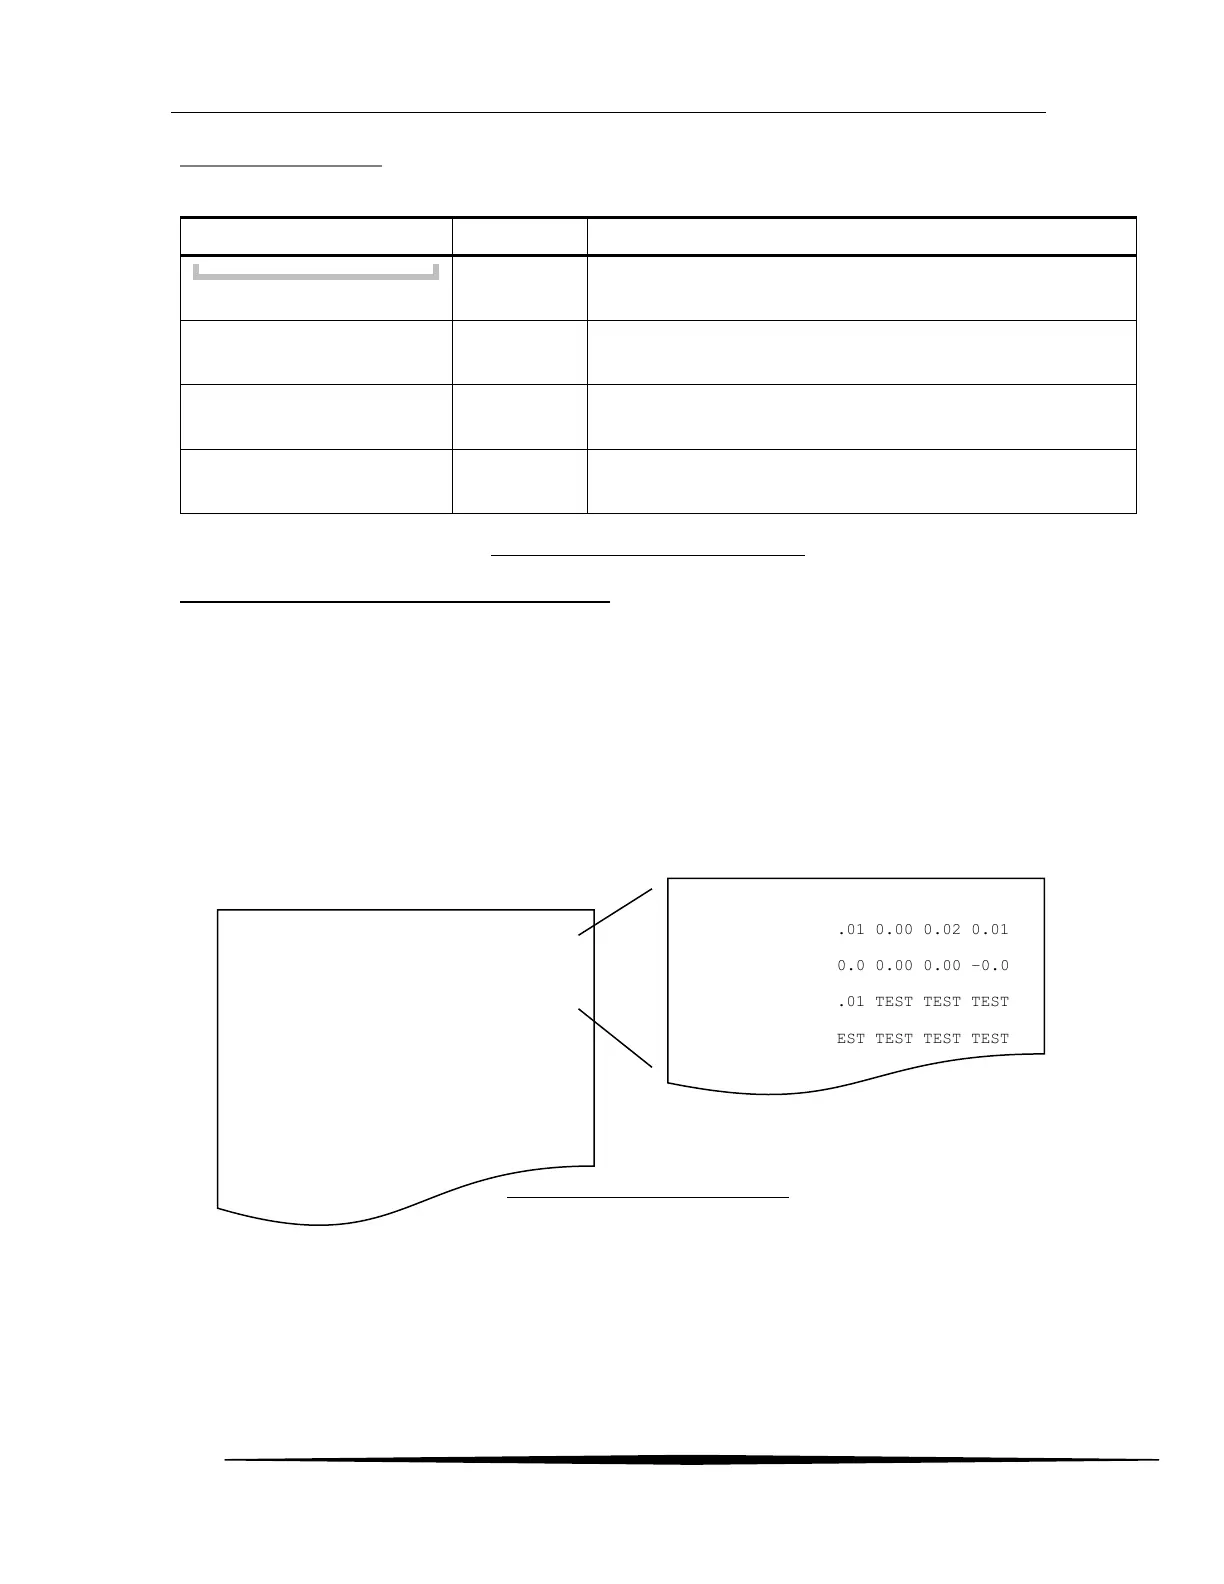
Figure 79. Data Log Single View Menu
Data Log Print Menus, Methods, and Settings
For transmitters with an optional RS232/RS485 interface, a data log report may be sent to a serial printer,
or “captured” to a file using a terminal emulation program. Many terminal emulation programs exist for
both Microsoft Windows® and non-Windows platforms.
The report consists of a series of lines, each containing a date and time, followed by up to 30 gas
readings. All fields on the line are separated by a TAB character (ASCII 9), which serves to keep the
fields aligned in columns. This format is suitable for most Epson protocol printers and for import into most
spreadsheet programs after capture. The date and time apply to the first gas reading on the line following
the time. Readings appearing in subsequent columns to the right were recorded at the programmed
sampling interval after the first reading. The format of the gas readings appear as described in Data Log
View Menu on page 60. A report example is shown below.
Figure 80. Data Log Print Example
In the example above, the first sample occurred at 22:40. The next sample to the right occurred at 22:41,
followed by the next at 22:42, and so on. This pattern is repeated to the end of the line, and then repeats
on the line below, and so on.
Scroll to a specific sample date.
Scroll to a specific sample time.
View the gas reading when sample was recorded (not
selectable).
View the Graph at the specified date and time.
07/09/14 22:40 0.01 0.00 0.02 0.01
07/09/14 22:44 –0.0 0.00 0.00 –0.0
07/09/14 22:48 0.01 TEST TEST TEST
07/09/14 22:52 TEST TEST TEST TEST
07/09/14 22:56 TEST TEST TEST TEST
07/09/14 23:00 0.07 0.06 0.07 0.06
07/09/14 23:04 0.06 0.05 0.06 0.06
07/09/14 23:08 0.05 0.05 0.04 0.05
07/09/14 23:12 0.06 0.05 0.05 0.04
07/09/14 23:16 0.01 0.01 0.01 0.00
07/09/14 23:20 0.00 0.00 0.00 -0.1
07/09/14 23:24 –0.0 0.00 0.00 0.00
07/09/14 23:28 ---- ---- ---- ----
07/09/14 22:40 0.01 0.00 0.02 0.01
07/09/14 22:44 –0.0 0.00 0.00 –0.0
07/09/14 22:48 0.01 TEST TEST TEST
07/09/14 22:52 TEST TEST TEST TEST
22:40
22:41
22:42
22:43
22:44
22:45
22:46
22:47
22:48
22:49
22:50
22:51
22:52
22:53
22:54
22:55