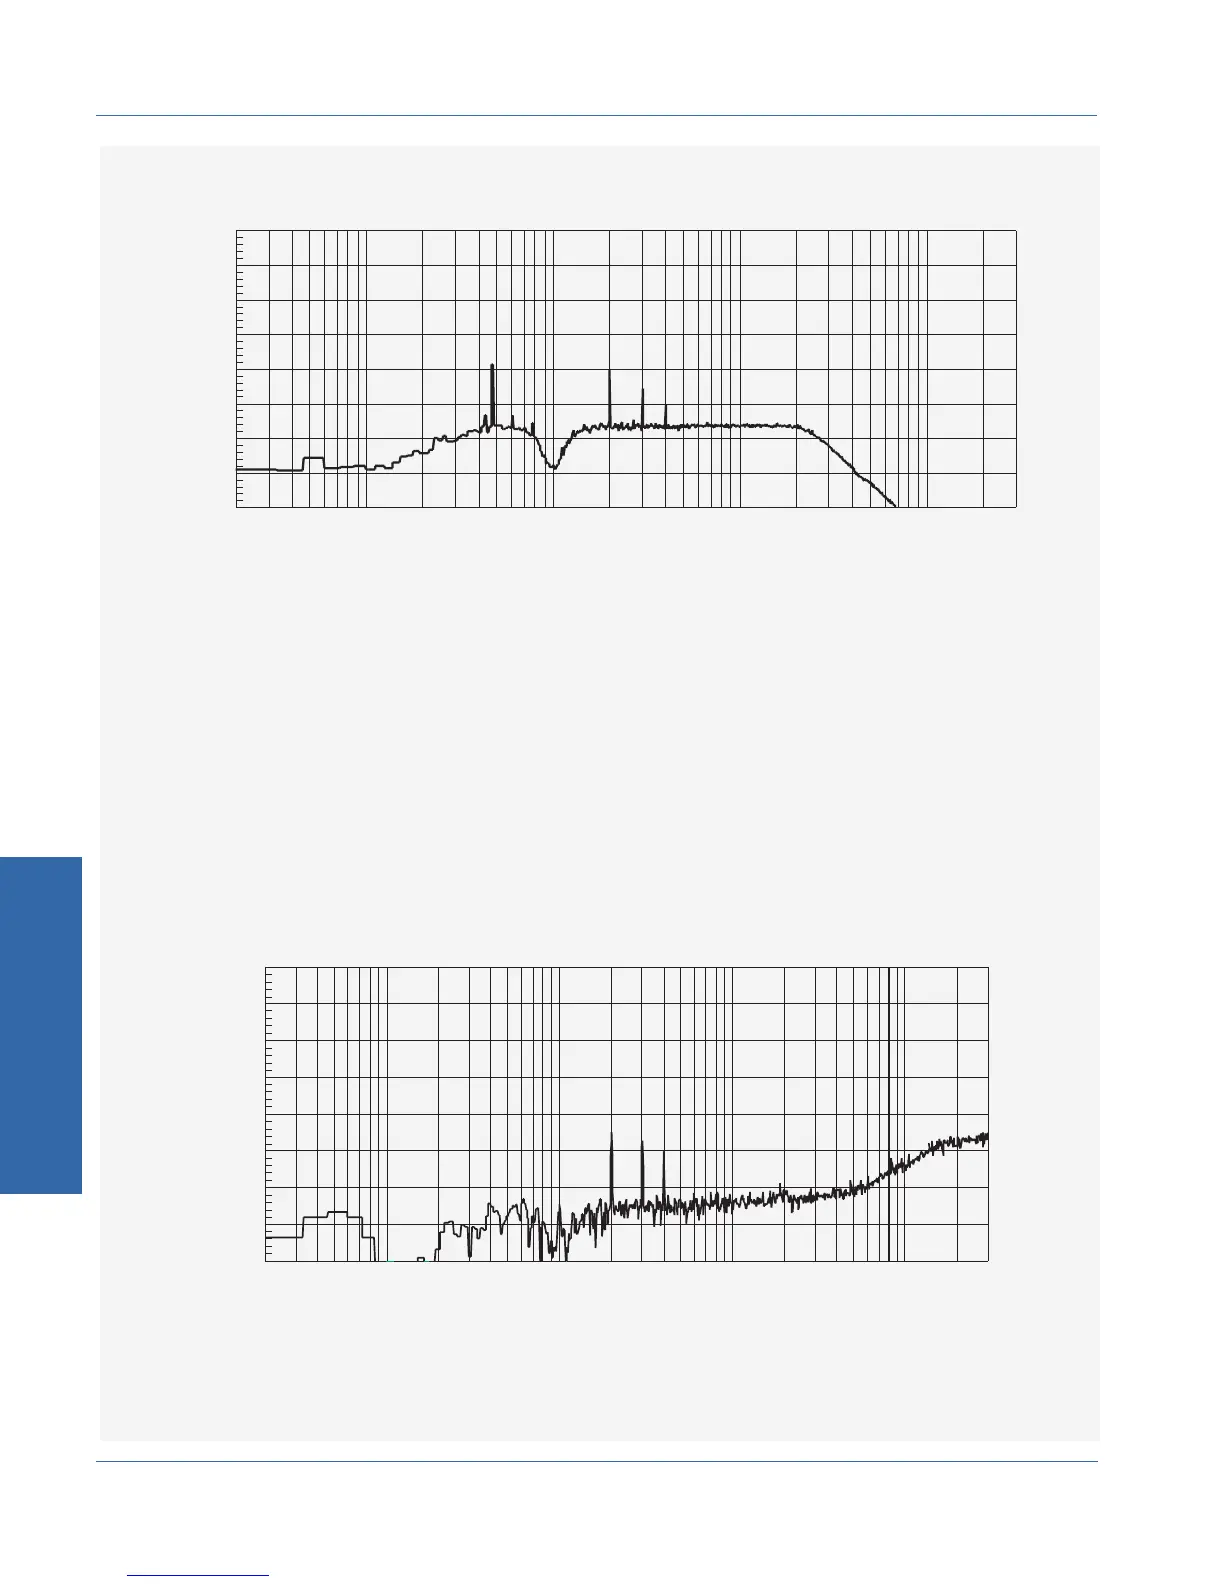
Next, we can invoke the 22 kHz lowpass filter to eliminate the
high-frequency noise. The spectrum now looks like this:
The THD+N still measures 0.185 %. From this, we can determine that
(in this particular case) the high-frequency noise did not make a
significant contribution to the measurement. It is dominated by the
distortion and interference tones.
Following is the spectrum of a different THD+N measurement. This
one comes from a device that generates a significant amount of
high-frequency noise. The THD+N measures 0.057 % with a lower
band limit of 400 Hz and a high band limit of 300 kHz. The spectrum
is shown after the bandreject filtering, which has removed the 1 kHz
fundamental.
20 50 100 200 500 1k 2k 5k 10k 20k 50k
Hz
-140
+20
-120
-100
-80
-60
-40
-20
+0
d
B
r
A
100k 200k 300k
Figure 4-14. Device with HF noise, 1 kHz fundamental filtered
-140
+20
-120
-100
-80
-60
-40
-20
+0
d
B
r
A
20 50 100 200 500 1k 2k 5k 10k 20k 50k
Hz
200k100k 300k
Figure 4-15. Spectrum with 22 kHz lowpass filter added
Understanding THD + N FUNCTION Descriptions
4 Functions
4-16 ATS-1 Access User's Manual