After the bandpass filter eliminates the 1 kHz fundamental tone, we are
left with the following:
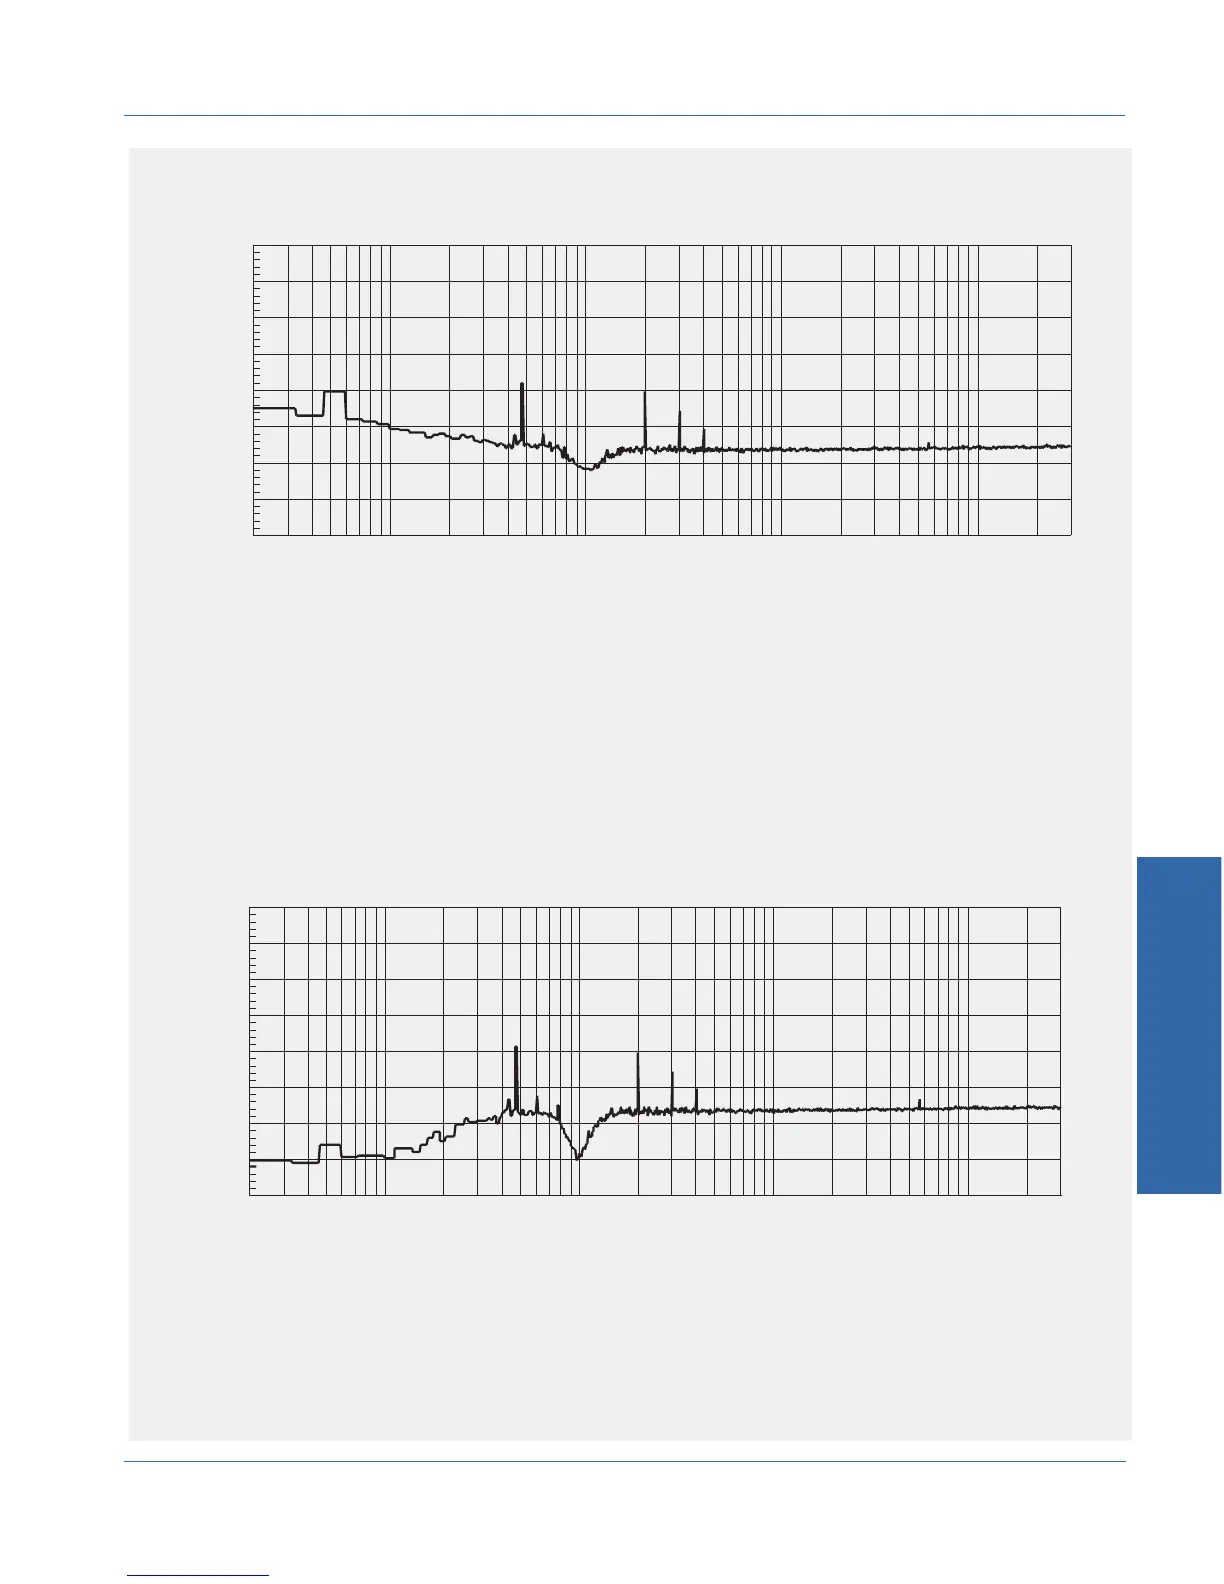
This signal contains contributions from harmonic distortion (at 2 kHz, 3
kHz, and 4 kHz), an interfering tone (at 490 Hz), random noise, and
60 Hz hum. The THD+N measurement includes all of these, and
reads 0.229 %.
If we use the 400 Hz bandpass filter to eliminate the hum, the spectrum
of the signal then looks like this:
The THD+N now measures 0.185 %. From this, we can determine
that the hum product was contributing 0.044 % to the THD+N
reading.
-140
+20
-120
-100
-80
-60
-40
-20
+0
20 50 100 200 500 1k 2k 5k 10k 20k 50k
Hz
d
B
r
A
200k100k 300k
Figure 4-12. Spectrum with 400 Hz bandpass filter applied
-140
+20
-120
-100
-80
-60
-40
-20
+0
d
B
r
A
20 50 100 200 500 1k 2k 5k 10k 20k 50k
Hz
200k100k 300k
Figure 4-13. Spectrum with fundamental filtered
FUNCTION Descriptions Understanding THD + N
4 Functions
ATS-1 Access User's Manual 4-15