5-25
Chapter 5. DETAILED DESCRIPTION OF EACH FUNCTION
However, MV high and low limits, output low limit (cooling), and output high limit
(cooling) are related to the heat MV and cool MV as follows.
100 %
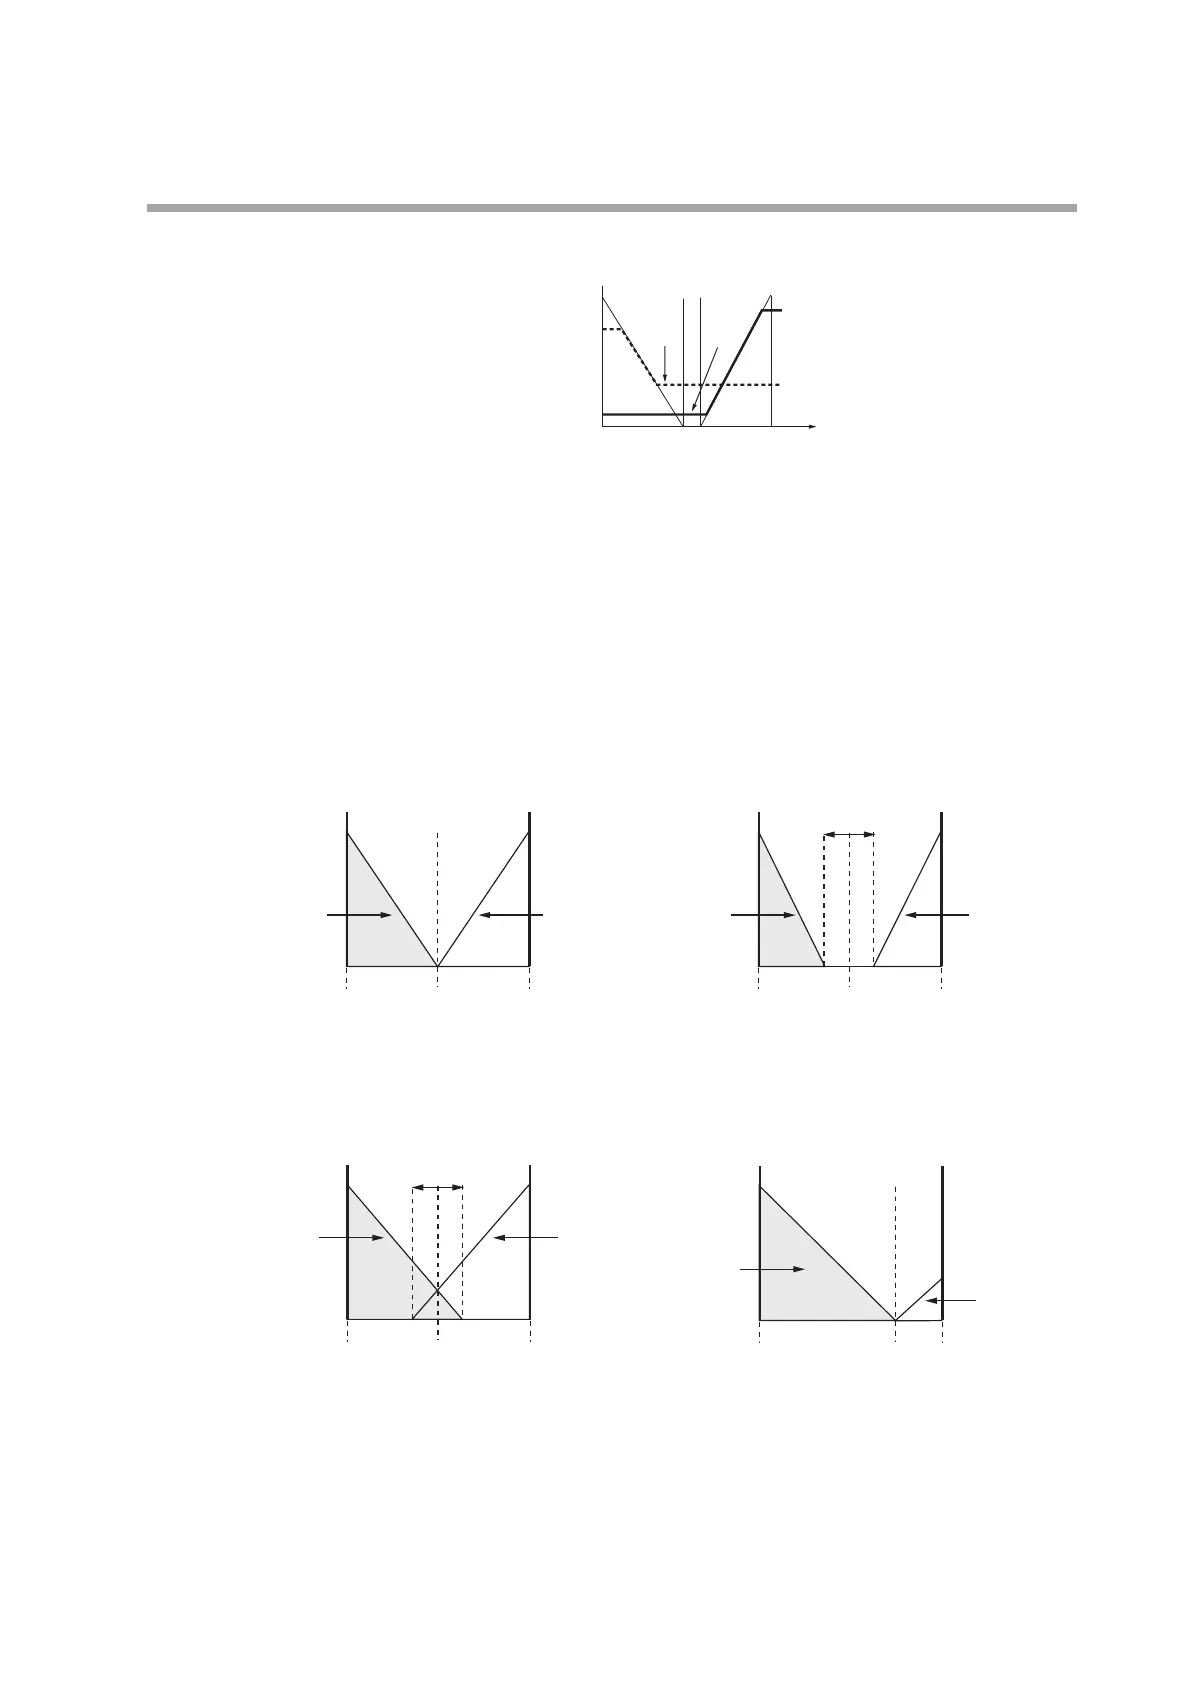
Note: The thick line and thick dotted line represent heat MV and cool MV respectively.
100 %
0 %
Cool
MV
Heat
MV
MV
Output high limit (cooling)
Output low limit (cooling)
MV low limit
MV high limit
• MV low limit ≤ heat MV ≤ MV high limit
• Output low limit (cooling) ≤ cool MV ≤ output high limit (cooling)
• Use the controller within the following range: 0.0 < heat/cool control change
point < 100.0.
• In the formula for rate of change, do not make the denominator = 0.
• Regardless of the heat/cool control change point setting, 50 % of MV is always the
point at which the PID group switches.
Examples of output
100.0 %
0.0 %
Heat MV
100.0 %
Cool MV
0.0 %
0.0 % 50.0 % 100.0 % MV
100.0%
0.0 %
Heat MV
100.0 %
Cool MV
0.0 %
0.0 % 50.0 %
Figure 2.
Dead zone > 0.0 %
Heat/cool control change point = 50.0 %
Figure 4.
Dead zone = 0.0 %
Heat/cool control change point = 75.0 %
Figure 1.
Dead zone = 0.0 %
Heat/cool control change point = 50.0 %
100.0 % MV
33.3 %
0.0 %
100.0 %
Cool MV
0.0 %
0.0 % 75.0 % 100.0 % MV
100.0 %
0.0 %
Heat MV
100.0 %
0.0 %
0.0 % 50.0%
Absolute value
of the dead zone
Figure 3.
Dead zone < 0.0 %
Heat/cool control change point = 50.0 %
100.0 % MV
In figure 4, when the MV is 100 %, the heat MV is 33.3 %. In this case, when the
heat/cool control change point is 50 % or more, if the MV is 100 %, the heat MV
high limit is less than 100 %. The change rate of the heat MV relative to the MV is
the same as that of the cool MV relative to the MV.