Basic Operation and Features
Basler A500k Series 3-39
PRELIMINARY
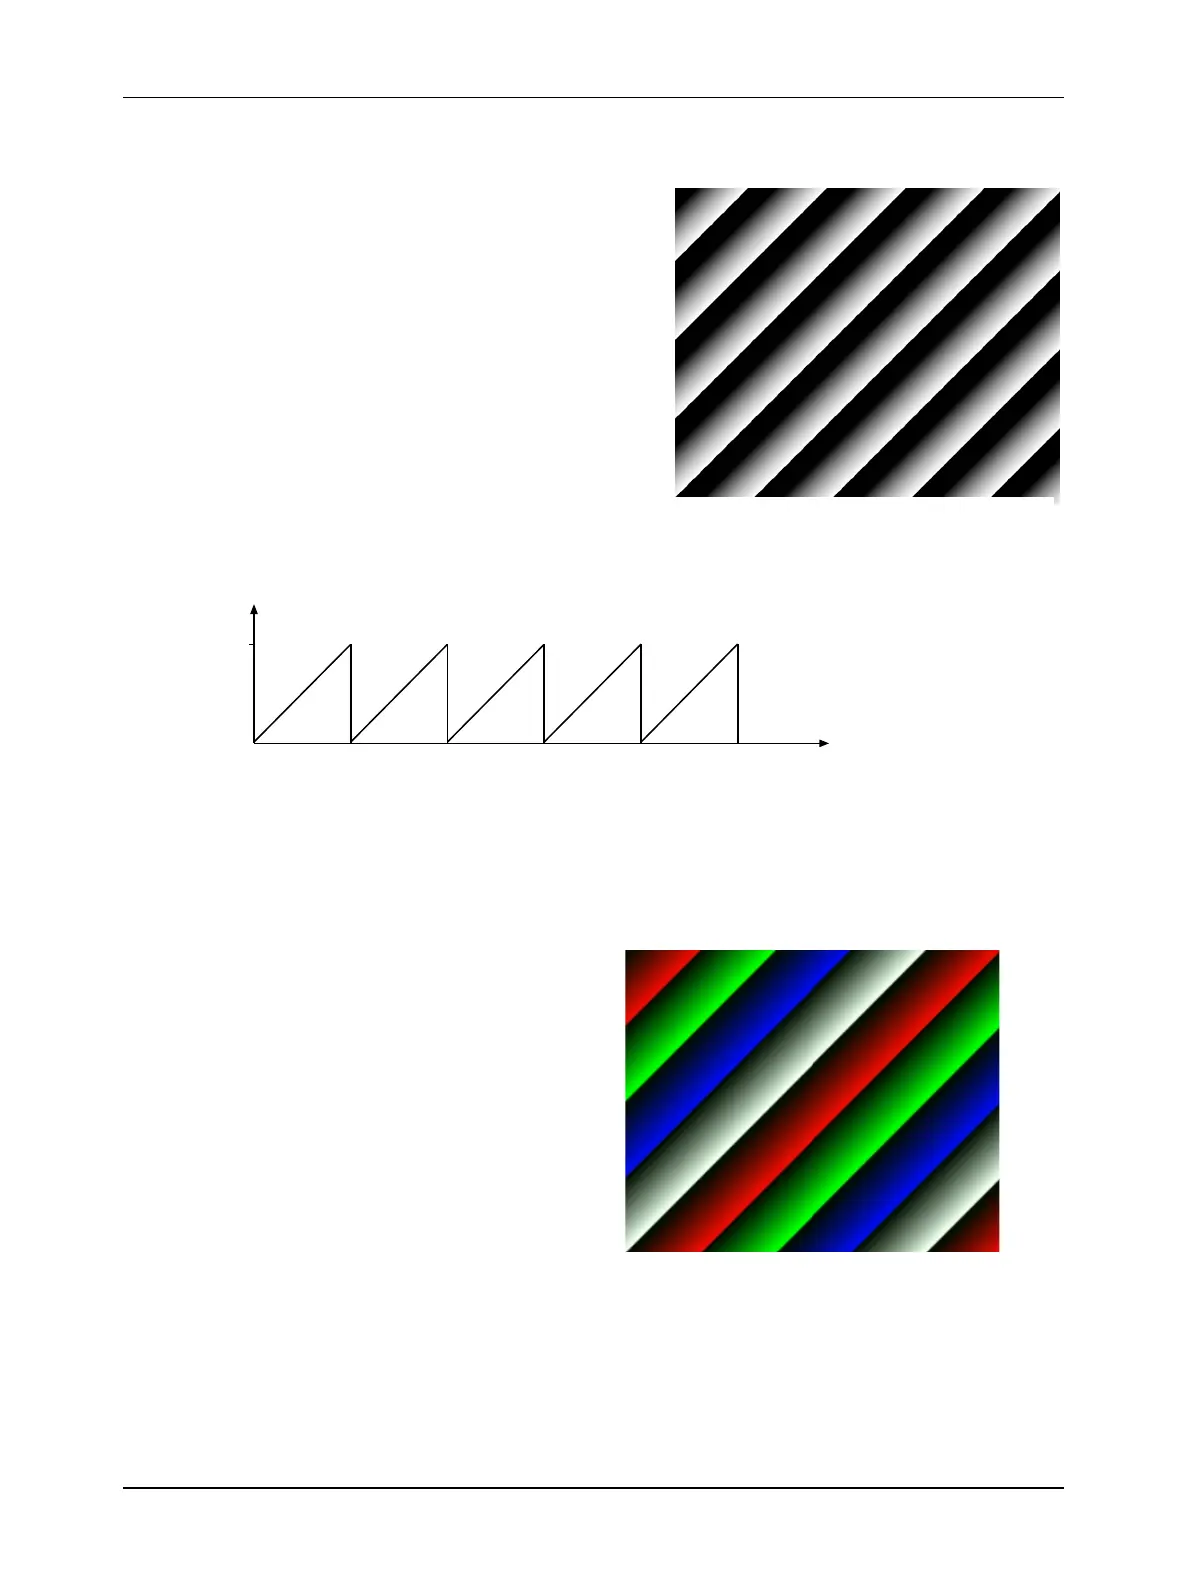
3.10.1 Gray Scale Test Image
The gray scale test image consists of lines with
repeated gray scale gradients ranging from 0 to
255. The first line starts with a gray value of 0 on
the first pixel, in the second line the first pixel
has a gray value of 1, in the third line the first
pixel has a gray value of 2, and so on.
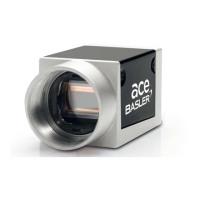
The mathematical expression for the test image
is: gray level = [x + y] MOD 256. This expression
is shown graphically in Figure 3-31.
Figure 3-31: Formation of Monochrome Test Image
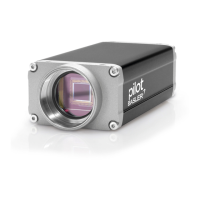
3.10.2 Color Test Image (A504kc and A501kc Only)
The color test image is similar to the gray
scale test image, except that the first
gray scale stripe is red, the second
green, the third blue, the fourth white,
the fifth red again.
Figure 3-30: Test Image
0
255
[gray
levels]
[pixel
numbers]
Figure 3-32: Test Image
red green blue white red
red
green
blue
white
red
green
blue
white