PN 177196BB
7-11
DATA MANAGEMENT AND REVIEW
DATA ANALYSIS - MEASUREMENT PRINCIPLES
7
6. Thresholds are used to exclude pulses from unwanted particles, such as debris, from
analysis.
a. A threshold is an electronically set size limit.
b. Particles equal to or above the threshold are analyzed and particles below the
threshold are excluded.
Histogram Development
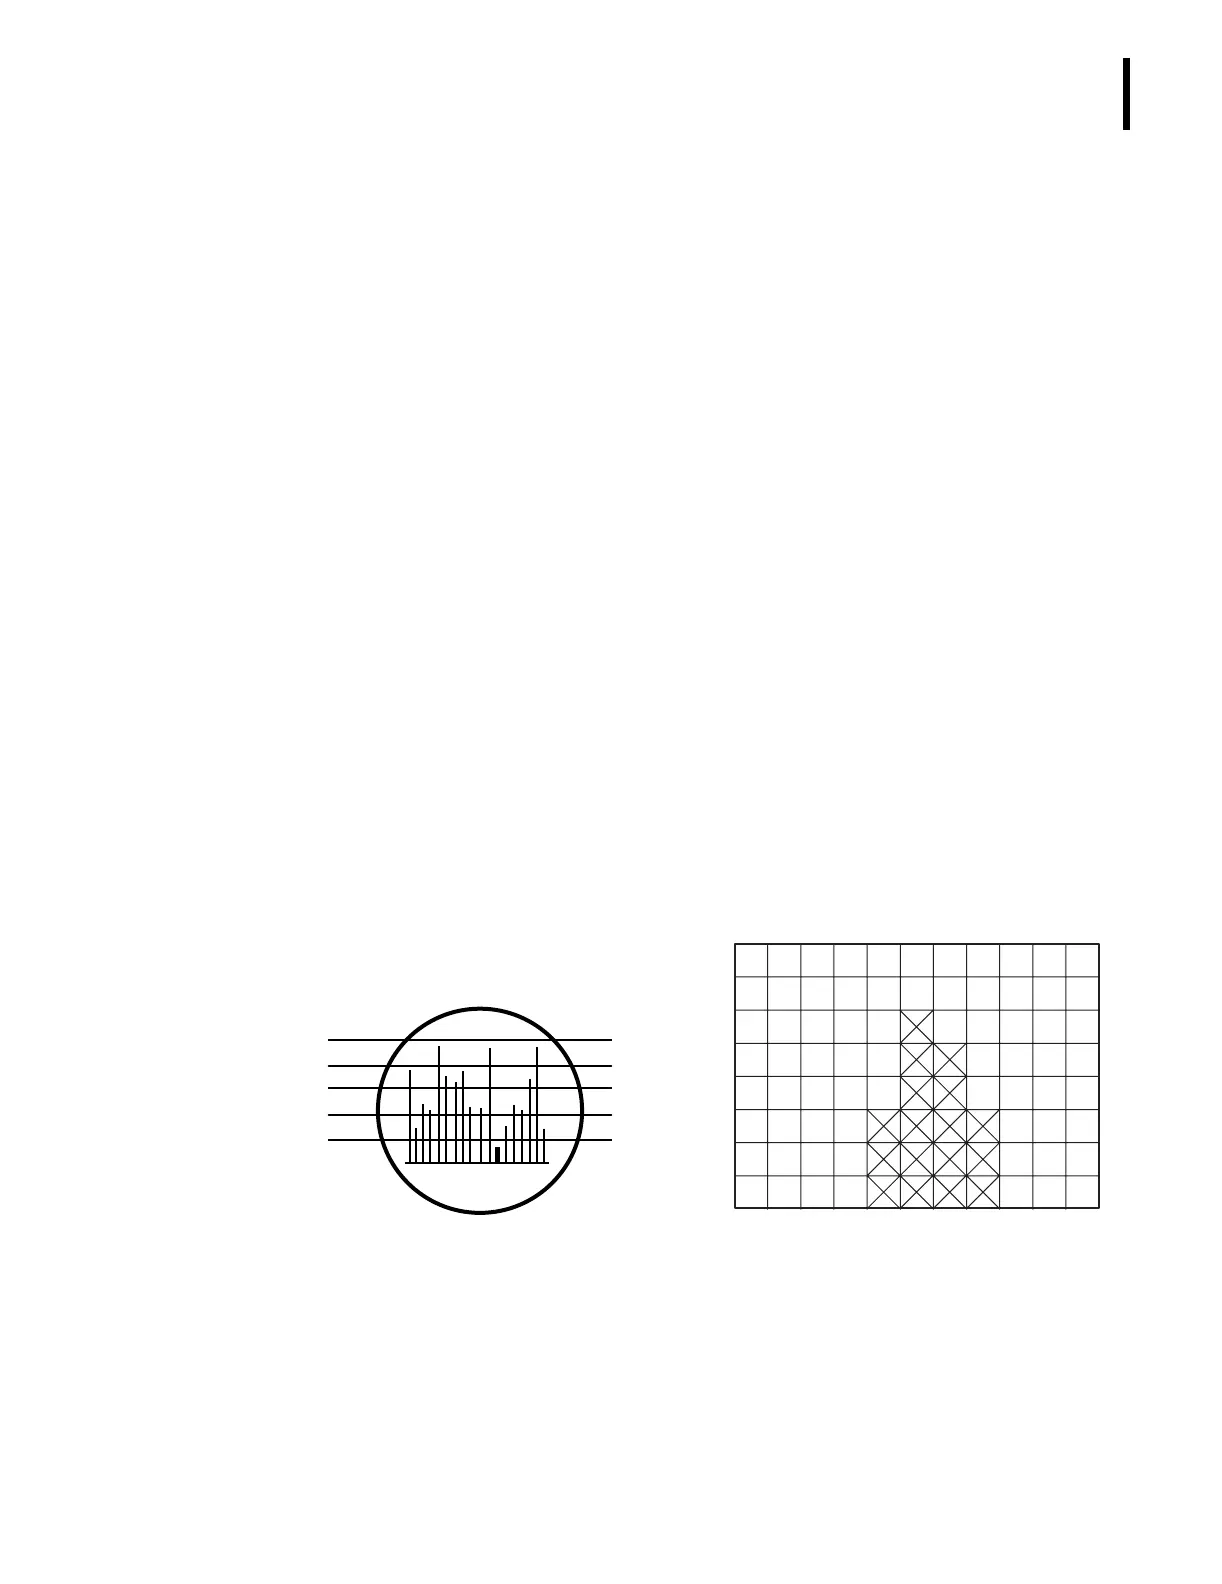
1. A succession of thresholds are used to sort particles by size and produce a size
distribution curve or histogram.
a. The lowest threshold (T
1
) is sometimes referred to as the Base Threshold.
b. The area between two adjacent thresholds is called a Channel.
1) Channel 1 (C1) is between T
1
and T
2
.
2) Channel 2 (C2) is between T
2
and T
3
, and so forth.
3) Each threshold represents a size.
4) For a particle to be counted in a particular channel, it must be larger than or
equal to the lower threshold but smaller than the upper threshold.
c. To produce a particle size distribution curve or histogram, the number of particles is
plotted on the Y-axis as Relative Number of particles and the particle size (or
volume) on the X-axis as Femtoliters (fL).
d. Histogram information can be used to determine the mean (average) size of the
particles, the dispersion of particles around the mean size, and subpopulations
within a main population.
e. A
C
•T 5diff AL instruments develop three histograms: WBC/BASO, RBC, and PLT.
T
5
40 fl
T
4
35 fl
T
3
30 fl
T
2
25 fl
T
1
20 fl
Channel 4
Channel 3
Channel 2
Channel 1
7
6
5
4
3
2
1
0 5 10 15 20 25 30 35 40 45
50
C1 C2 C3 C4
Femtoliters
Number
 Loading...