PN 177196BB
4-21
QUALITY ASSURANCE
INTERPRETING AND USING THE XB/XM DATA
4
b. Does an XB/XM analysis at regular intervals on sets (batches) of 20 patient results,
determining the batch mean of each parameter.
1) The calculation is done automatically.
2) This batch mean is not a simple average value of the patients’ parameter results,
but a type of “weighted moving average” that statistically allows the small
batch of 20 patient samples to appear as if it were a larger set of about 100.
c. Compares each batch mean to its expected XB/XM mean value.
1) If the batch means are inside the expected XB/XM limits, the batch is “IN” and
the instrument is considered to be functioning properly.
2) If a batch mean is outside the expected XB/XM limits, the batch is “OUT” and
must be investigated.
d. Displays the batch data in graphs and tables.
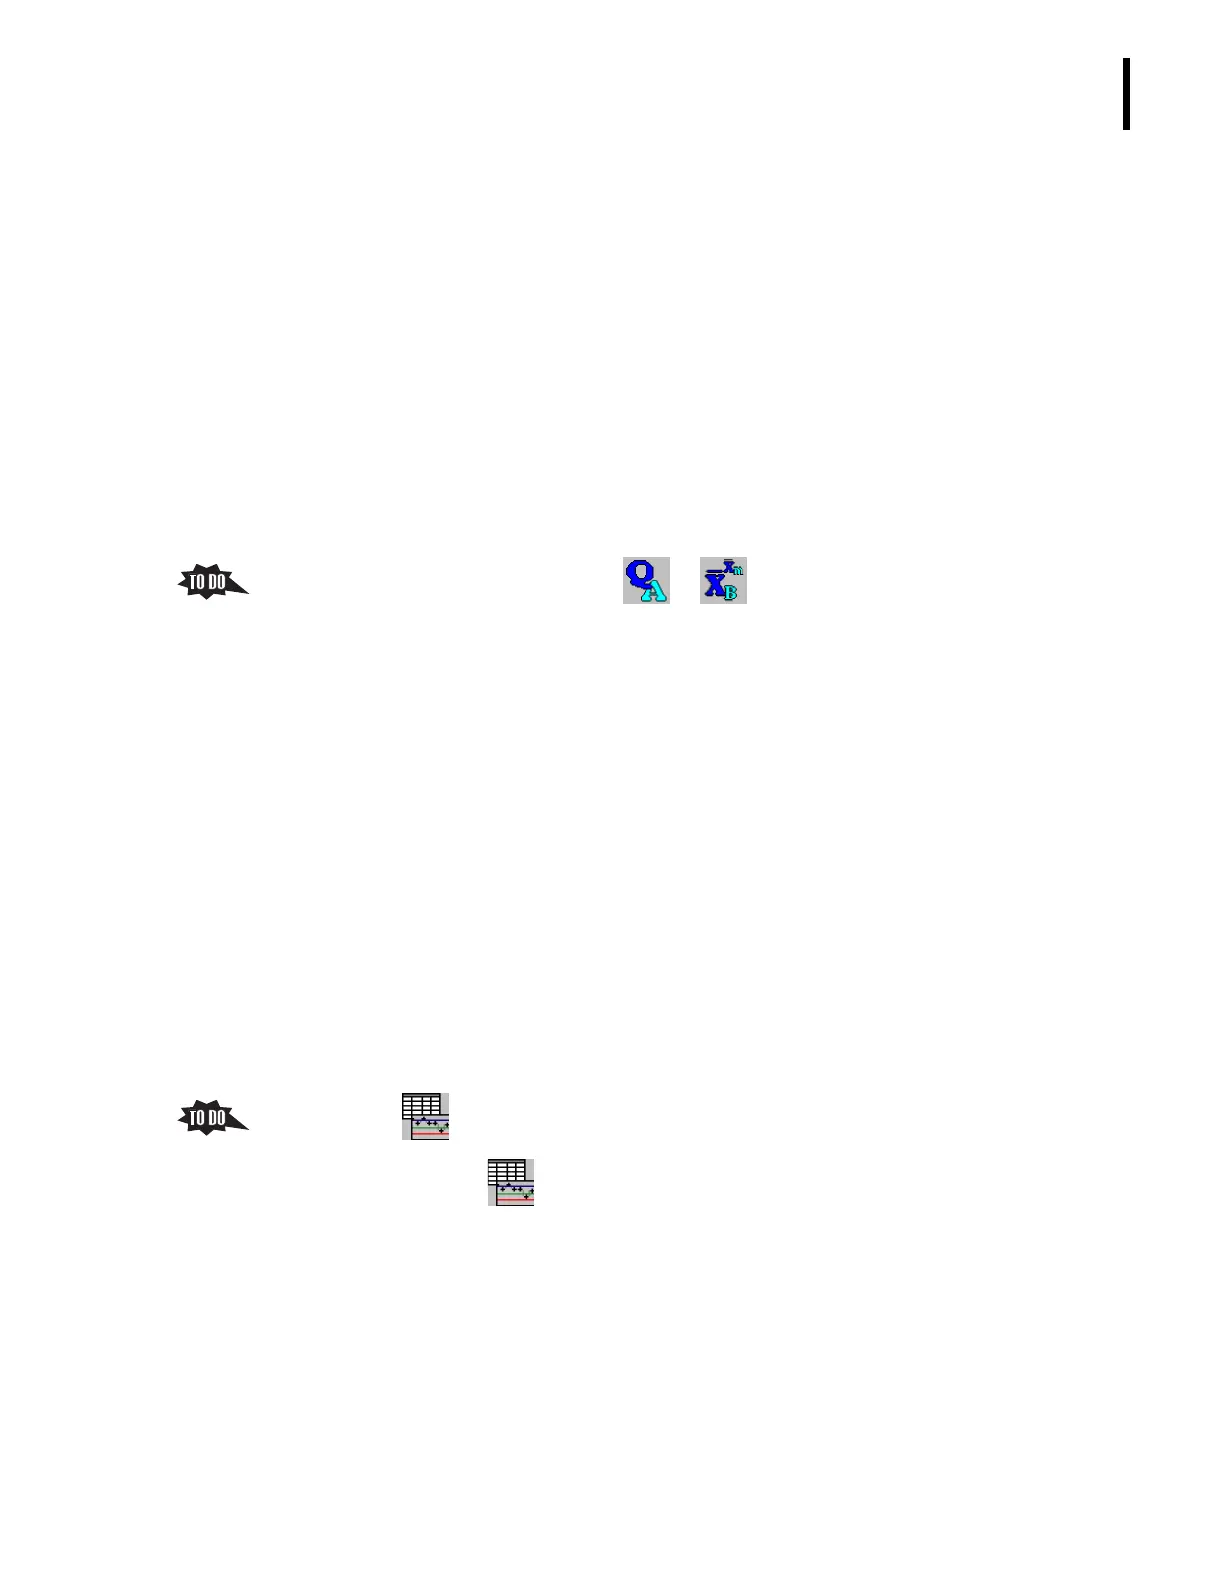
2. From the Main Menu screen, click tt to display the XB/XM screen.
a. The main XB/XM screen displays graphs of the XB/XM results, and is the software
path to the XB/XM data in tables, the screen for reviewing and deleting data in a
particular XB/XM batch, and the screen for entering/editing the target values and
limits for the XB/XM analysis.
b. Note the right side of the screen displays the XB/XM graphs for the parameters
included in the analysis.
1) Each graph contains three areas.
a) The central line represents the actual XM mean value for that parameter.
b) A line above XM mean value (central line) represents the upper limit and a
line below the XM mean value represents the lower limit boundaries
c) The areas showing dashes are the out-of-limit areas.
2) The data points are displayed in reference to the XB/XM limits.
a) Each data point represents 20 samples.
b) Up to 60 data points (batches) can be displayed and printed.
3) Graphs are good for identifying trends and shifts.
c. Click and the right side of the screen displays the XB/XM data in tables.
Note: Clicking alternates the display between graphs and data tables.
1) The table on the top of this screen displays the parameter means for up to 60
batches.
a) The most recent batch is located at the bottom of this table.
b) After the first 60 batches are completed, this option always displays the
last 60 completed batches.
c) After the 60
th
batch is completed, the table begins to rollover, deleting the
oldest batch results to make space for the last completed batch results.
 Loading...