Set Up a Purification
To add a gradient segment, press the + button in the gradient
table or the expanded gradient graph. The new segment will be
added after the selected segment or node or at the end of the
gradient if nothing is selected.
To delete a node or segment, select it and press the – button in
the gradient table or the expanded gradient graph.
To increase or decrease the length of a gradient segment or
change the solvent mix, either 1) drag the segment or node to
the desired position in the gradient graph, or 2) change the
value in the gradient table.
Note that it is possible to zoom in and out of the gradient using
the pinch-to-zoom feature. To reset the zoom, press
.
Gradient Parameters
»
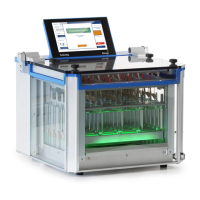
Unit or CV/mL/mm:ss: The gradient length unit. CV (column
volumes), milliliters, or minutes and seconds; see Figure 20.
»
Start: The percentage of the strong solvent at
the beginning of the gradient segment.
»
End: The percentage of the strong solvent
at the end of the gradient segment.
»
A-D: The solvents to be used.
»
M/Modifier: If you want to use a fixed percentage of
modifier during the purification, select the solvent
to be used and its percentage in the solvent mix.
»
Equil./Equilibration: The column is equilibrated before the
run, unless this options is turned off. The equilibration
volume and flow rate are set automatically based on the
selected column type. To see the settings, expand the
Column panel (see Figure 24 on page 10). We strongly
recommend that the equilibration is not turned off.
Figure 20. The gradient length unit can be selected in the gradient table
(as shown above) and in the expanded gradient graph (see Figure 21).
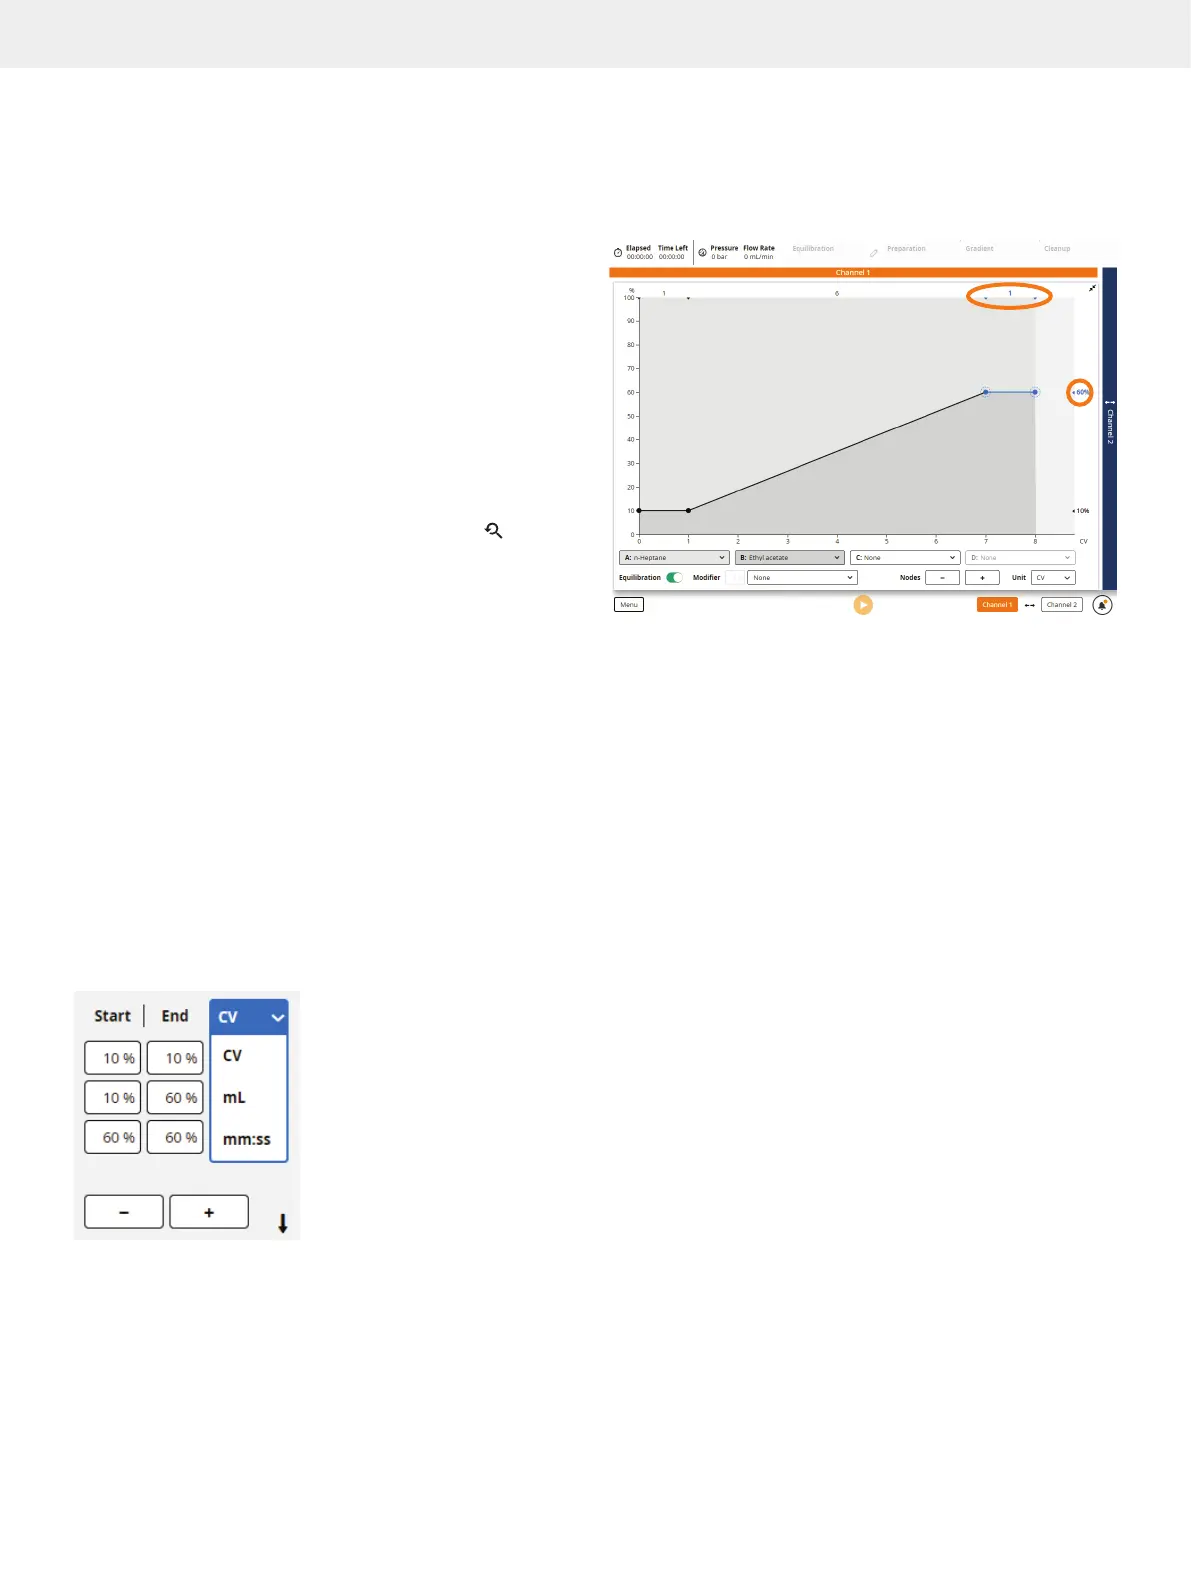
Figure 21
. The expanded gradient graph. Gradient markers along the top
and right show the length and solvent percentage for the segments.
Calculate a Gradient from TLC Data
Note the following when using the TLC to Gradient editor:
»
Accuracy of prediction can be reduced if using
alcohols, such as methanol and ethanol, very volatile
modifiers such as diethyl ether, or modifiers that
permanently alter the properties of the silica.
»
Reversed-phase TLC is not supported.
»
Slight variations in migration rates may occur if samples are
applied too close to the edge of the TLC plate. Apply samples
at least 10 mm from the edge to avoid the edge effect.
To calculate a purification gradient from the R
f
values obtained
from TLC analysis:
1. Open the TLC to Gradient editor (see Figure 22 on
page 10) by pressing TLC.
2. Select the Strong Solvent text box and enter the percentage
of the strongest (most polar) solvent in the TLC analysis.
3. Mark the solvent front of the TLC plate by sliding the Front
line to the correct position.
4. Enter the R
f
value of the product of interest in the R
f
Product
text box or by sliding the Product line to the correct position
on the TLC plate.
5. Enter the R
f
value of the impurity closest below and above
the product in the R
f
Impurity 1 and R
f
Impurity 2 text boxes
or by sliding the corresponding lines to the correct positions
on the TLC plate. A value for R
f
Impurity 1 is required.