EasyManuals Logo
Home>Casio>Calculator>ClassPad 300

Casio ClassPad 300 User Manual

Casio ClassPad 300
670 pages
To Next Page IconTo Next Page
To Previous Page IconTo Previous Page
Page #179 background imageLoading...
Page #179 background image
20021201
2-9-3
Using the Main Application in Combination with Other Applications
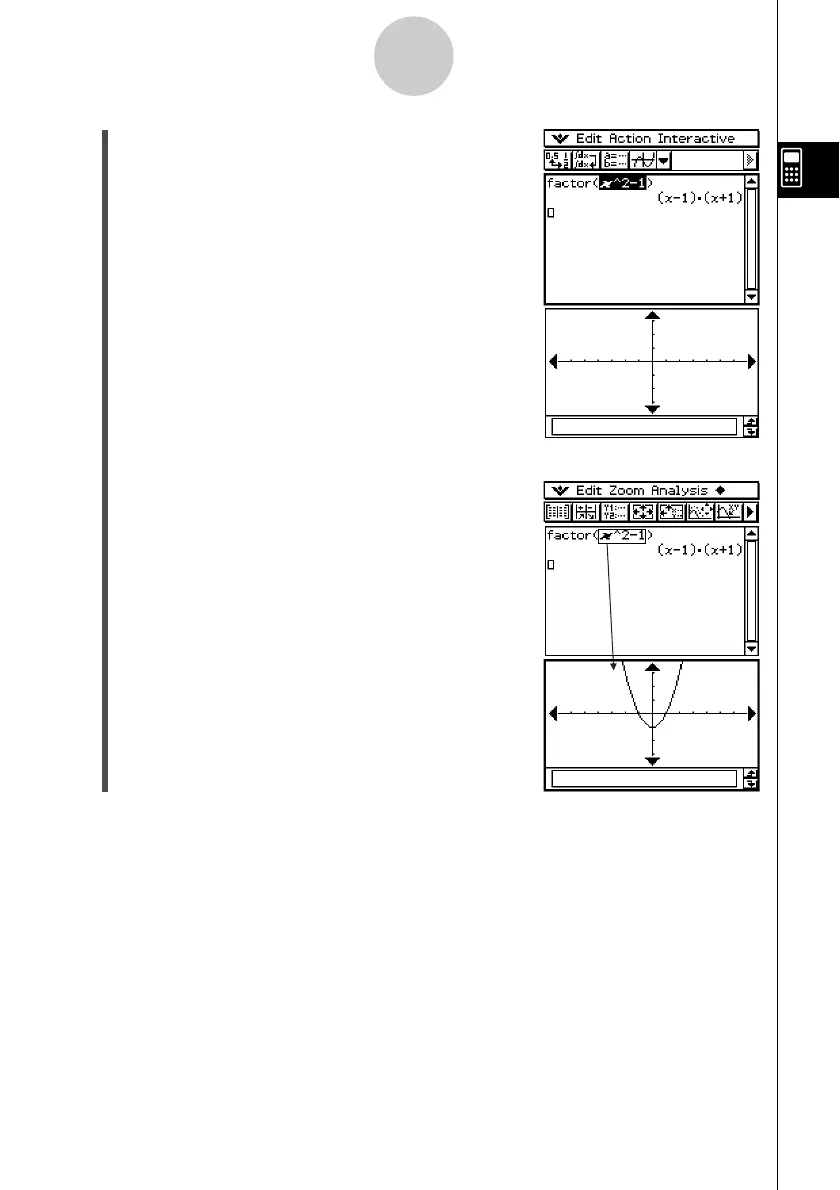
(3) Drag the stylus across “x^2 – 1” in the work area to
select it.
(4) Drag the selected expression to the Graph window.
This graphs y = x
2
– 1. This graph reveals that
the x-intercepts are x = ±1.
Tip
As can be seen in the above example, a graph can be drawn when you drop an expression in the
form of f(x) into the Graph window. In the case of the 3D Graph window, the expression must be
in the form of f(x,y).
• For more information about the Graph window, see Chapter 3. For more information about the 3D
Graph window, see Chapter 5.

Table of Contents

Other manuals for Casio ClassPad 300

Questions and Answers:

Question and Answer IconNeed help?

Do you have a question about the Casio ClassPad 300 and is the answer not in the manual?

Casio ClassPad 300 Specifications

General IconGeneral
BrandCasio
ModelClassPad 300
CategoryCalculator
LanguageEnglish

Related product manuals