20021201
3D Graph Example
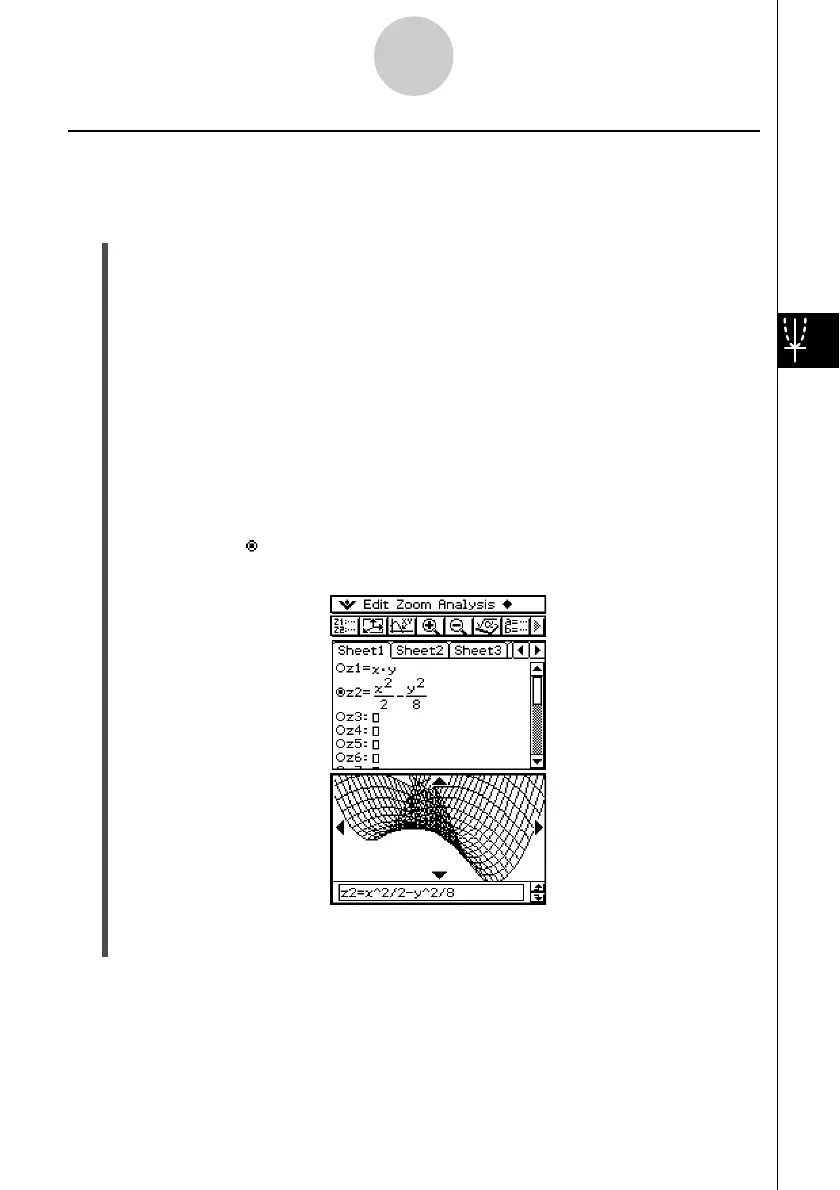
This example shows how to graph the hyperbolic paraboloid z = x
2
/2 – y
2
/8.
u ClassPad Operation
(1) In the 3D Graph application, make the 3D Graph Editor window active.
(2) Tap 7 to display the View Window dialog box, and then configure the parameters
shown below.
xmin = –3 xmax = 3 xgrid = 25
ymin = –3 ymax = 3 ygrid = 25
angle
θ
= 45 angle
φ
= 70
•Except for angle
θ
, all of the above settings are initial defaults.
•After everything is the way you want, tap [OK] to close the View Window dialog box.
(3) Tap line z2 on the 3D Graph Editor window, and then input x
2
/2 – y
2
/8.
x{2/2-y{2/8
(4) Press E.
• This stores the expression you input and selects it, which is indicated by the button
changing to “ ”.
(5) Tap
%
to graph the expression.
5-3-3
Drawing a 3D Graph
•Here, you can use the cursor key to rotate the graph on the display. For more
information, see “5-4 Manipulating a Graph on the 3D Graph Window”.