20021201
Including 3D Graphing Functions in a Program
The methods for using 3D graphing functions in a program are identical to those for normal
(non-3D) graphing functions, except that you can only graph one 3D graph at a time. For
information about commands that are unique to 3D graphing, see “Application Command
List” on page 12-6-15.
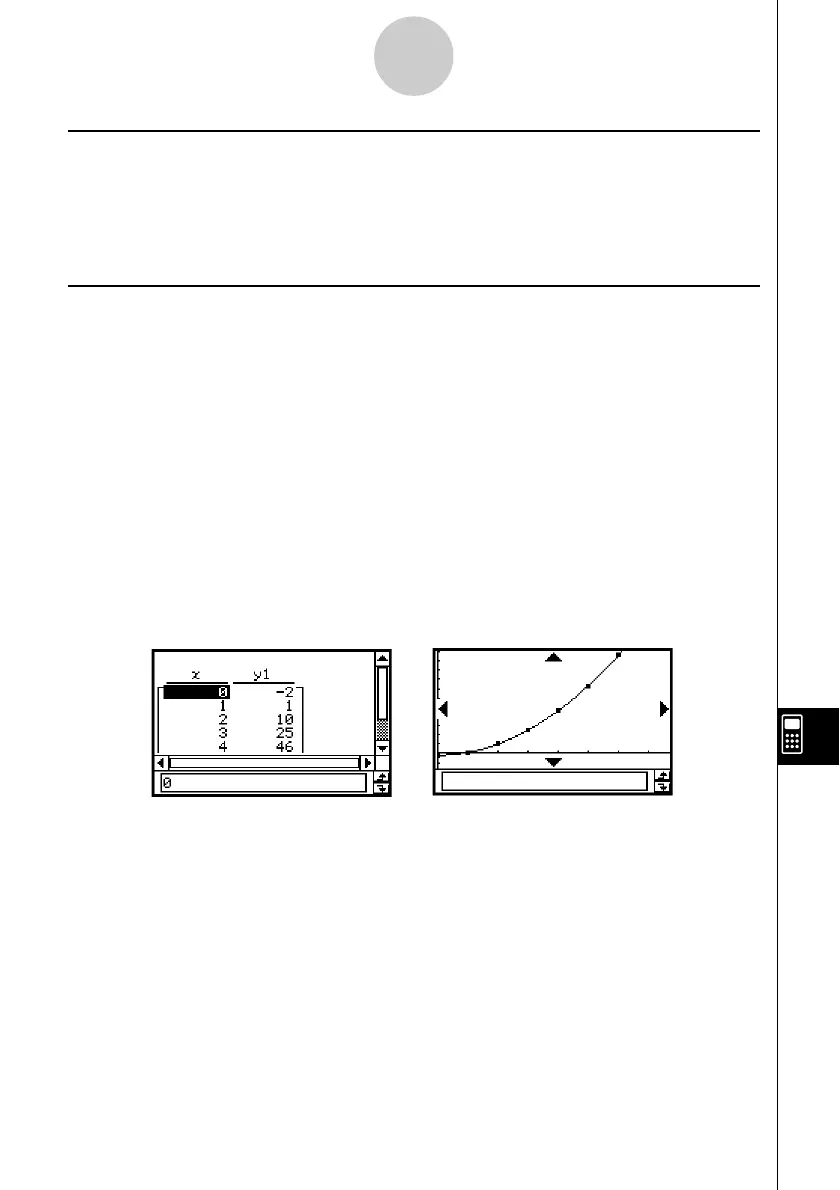
Including Table & Graph Functions in a Program
Tab le & Graph functions can be included in a program to generate number tables and draw
graphs.
Example: DefaultSetup
ClrGraph
ViewWindow 0, 7.7, 1, –14, 110, 10
GraphType "y="
Define y1(x) = 3 × x^2 – 2
GTSelOn 1
0 S FStart
6 S FEnd
1 S FStep
SheetActive 1
DispFTable
Pause
DrawFTGCon
12-7-2
Including ClassPad Functions in Programs