20021201
Drawing a Med-Med Graph
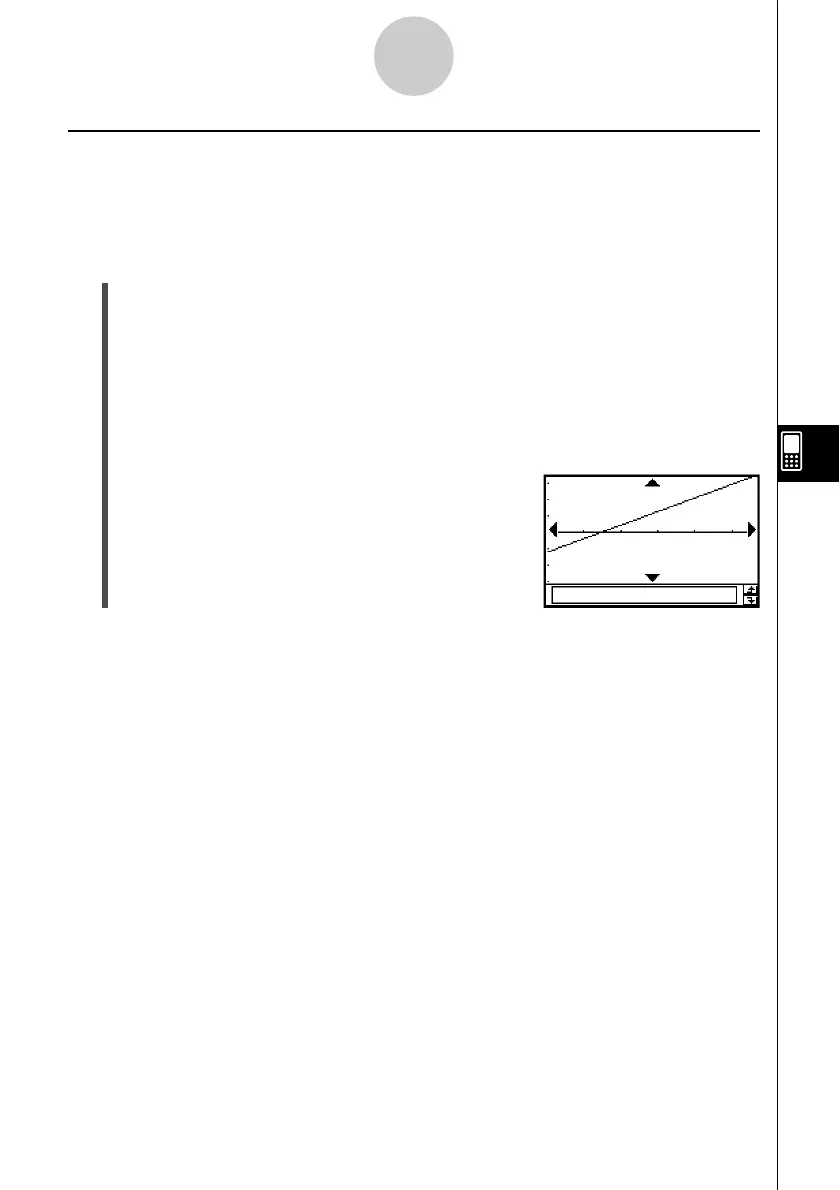
When you suspect that the data contains extreme values, you should use the Med-Med
graph (which is based on medians) in place of the linear regression graph. Med-Med graph is
similar to the linear regression graph, but it also minimizes the effects of extreme values.
u ClassPad Operation
Start the graphing operation from the Statistics application’s Graph window or List window.
From the Graph window
Tap [Calc] [MedMed Line] [OK] [OK] ".
From the List window
Tap [SetGraph][Setting...], or G.
On the Set StatGraphs dialog box that appears, configure a StatGraph setup with the
setting shown below, and then tap [Set].
Type: MedMed
Tap y to draw the graph.
7-5-6
Graphing Paired-Variable Statistical Data
The following is the Med-Med model formula.
y = a·x + b
a
:Med-Med graph slope
b :Med-Med graph y-intercept
Tip
• When specifying a list of frequency values, make sure that the list contains positive integers only.
Non-integer values (such as those with a decimal part) cause an error during statistical
calculations.