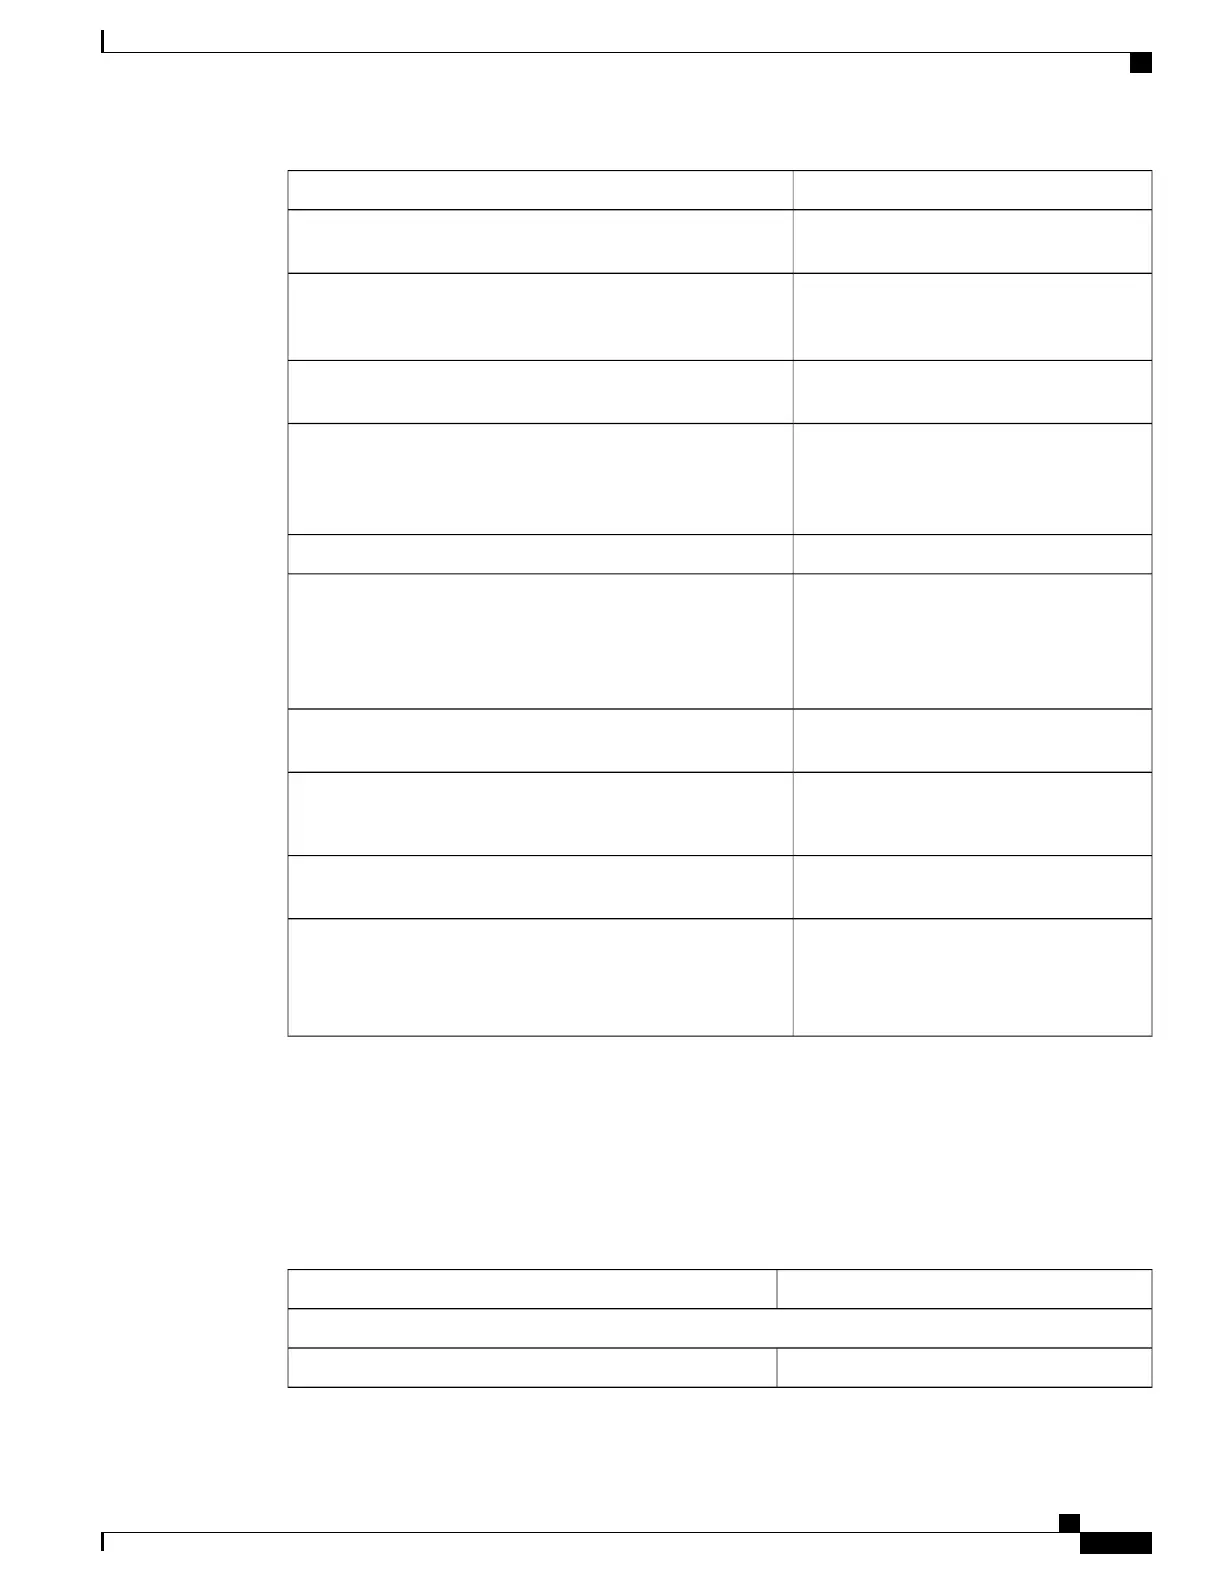
Enter this command:To do this:
show session subsystem facility sessmgr
all
Display statistics for the Session Manager.
show system uptimeCheck the amount of time that the system has been operational
since the last downtime (maintenance or other). This confirms
that the system has not rebooted recently.
show ntp statusVerify the status of the configured NTP servers. Node time
should match the correct peer time with minimum jitter.
show clock universalCheck the current time of a chassis to compare network-wide
times for synchronisation or logging purposes. Ensure network
accounting and/or event records appear to have consistent
timestamps.
show logsView both active and inactive system event logs.
show snmp trap historyCheck SNMP trap information. The trap history displays up
to 400 time-stamped trap records that are stored in a buffer.
Through the output, you can observe any outstanding alarms
on the node and contact the relevant team for troubleshooting
or proceed with SGSN troubleshooting guidelines.
show crash listCheck the crash log. Use this command to determine if any
software tasks have restarted on the system.
show alarm outstanding all
show alarm all
Check current alarms to verify system status
show alarm statisticsView system alarm statistics to gain an overall picture of the
system's alarm history.
show srp info
show srp monitor all
show srp checkpoint statistics
If enabled, view statistics associated with Service Redundancy
(SRP) protocol and Inter-Chassis Session Recovery (ICSR).
Periodic Status Checks
Depending upon system usage and performance, you may want to perform these tasks more frequently than
recommended.
Table 23: Periodic Status Checks
Enter this command:To do this:
Monthly
dir /flash
Check for unused or unneeded files on /flash.
ASR 5500 Installation Guide
117
System Monitoring
Periodic Status Checks
 Loading...