Page 12-10 Infinity Gamma Series VF4
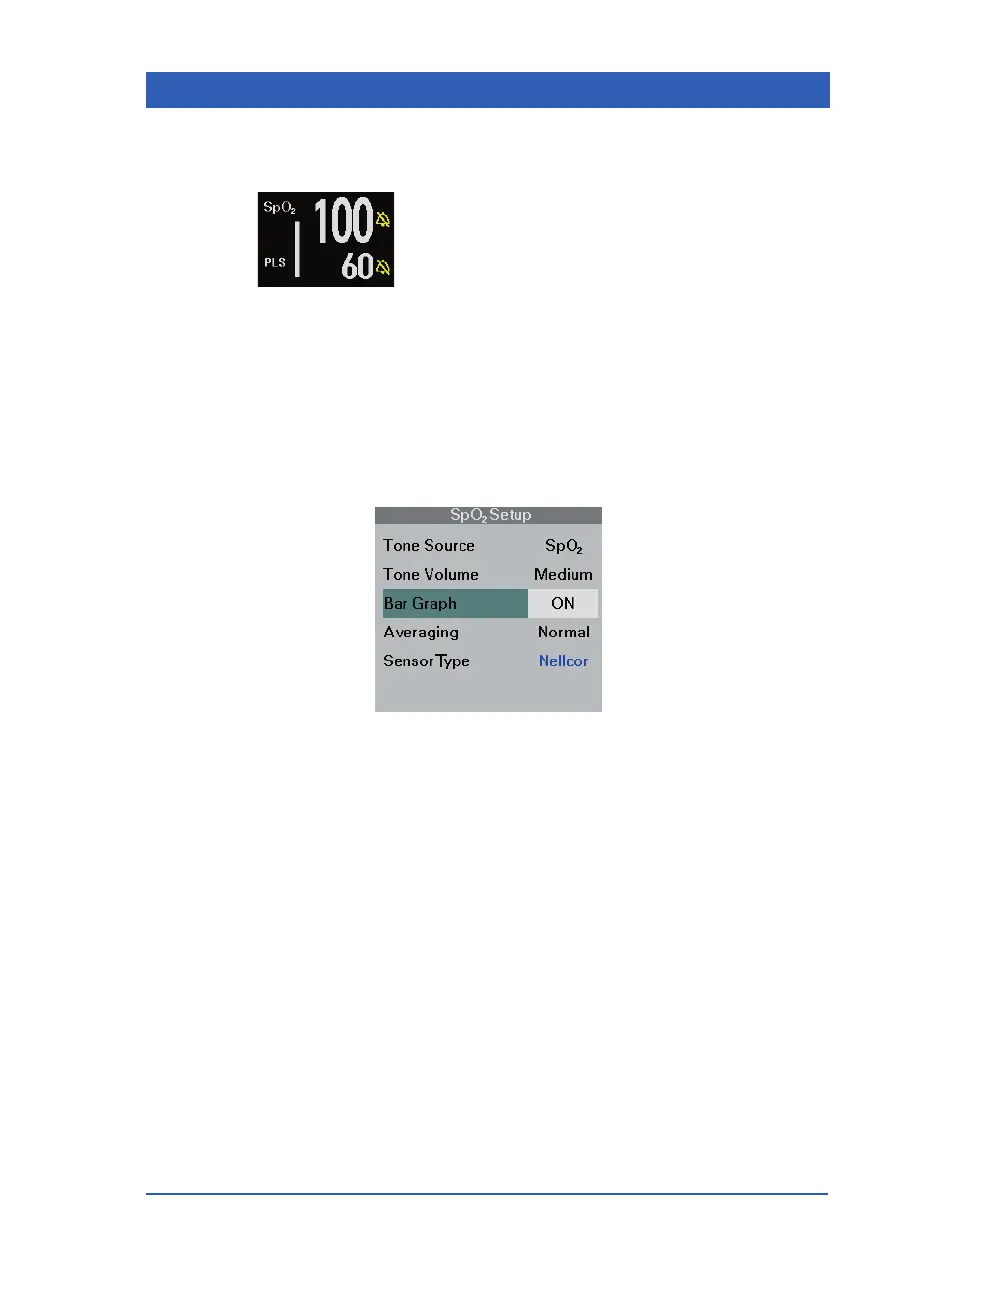
Signal Strength Bar Graph
The monitor can display a pulsing bar graph.
The number of illuminated segments is propor-
tional to the pulse amplitude. Proper sensor
placement and environmental conditions ensure
a strong signal. Refer to the section Sensor
Application for details.
STEPS: Displaying the Signal Strength Bar Graph
1. Click on the SpO2 parameter box.
2. Click on
Bar Graph.
3. Select
ON or OFF and click the knob.