5 | Basic operation of the D-ISC 100
D-ISC 100 x xx2
67
5.2.1 Presentations in the display
Fig.5.1: Display
●
Displays
show measured values and messages. It is not pos-
sible to edit these or to adjust any settings here!
Displays
can be identified by the date and time in the header
bar (see example on the left).
Fig.5.2: Menu
●
Menus
are used to perform parameterisation and
configuration tasks.
Menus
can be identified by the work "Menu" followed by a
combination of letters and numbers in the header bar (see ex-
ample on the left).
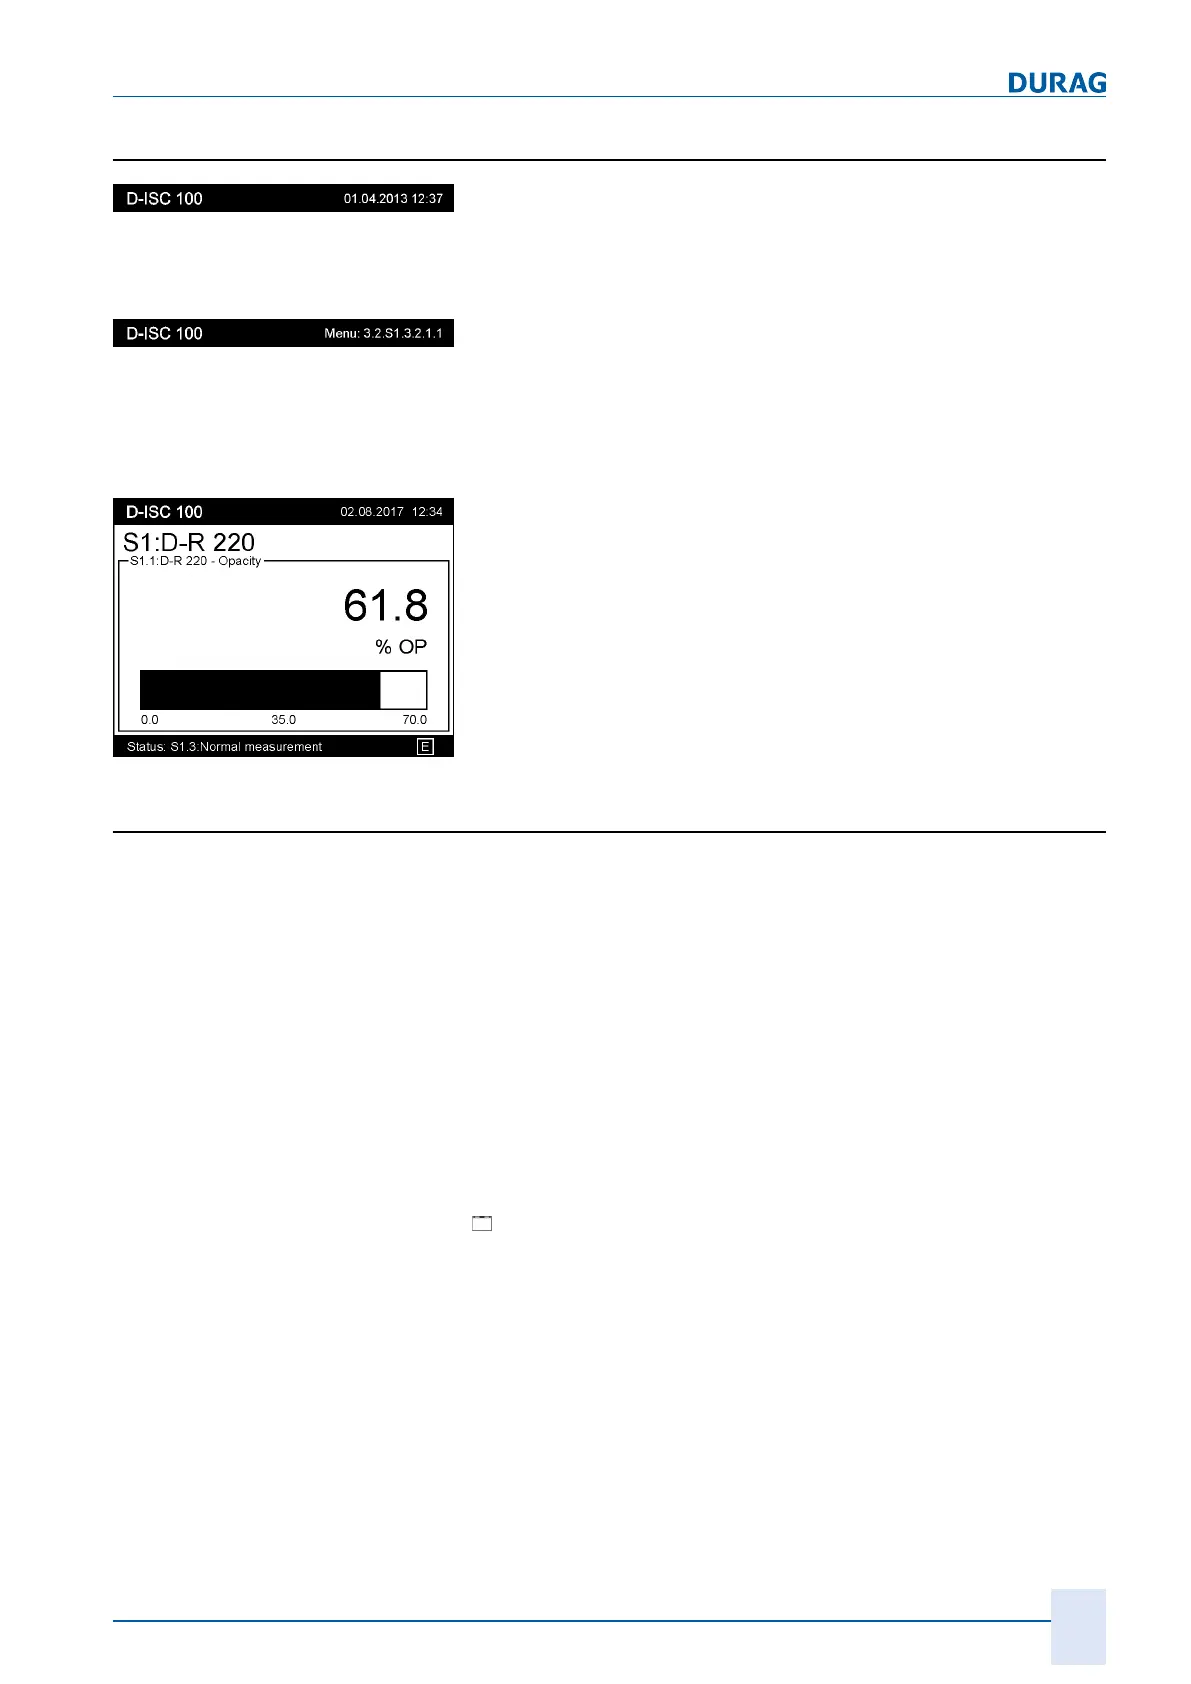
Fig.5.3: Presentations (display)
The combination of letters and numbers is the unique address for
the displayed menu.
The measured value and status displays, together with the avail-
able menus, are prepared by the system as required for the con-
nected sensors. This means that the number of available dis-
plays and menus varies with the number of connected sensors.
5.2.2 Display of measured values and status
After the D‑ISC100 has been switched on, the system first goes
through an initialisation phase with a sequence of displays
shown on the screen. Once this phase is complete, the unit will
show the configured measured value display or displays in the
selected display mode.
For information on the configuration of the measured value dis-
plays, see also Section
● 15.9 Examples: Selection of the displayed data [}170]
● 15.1 Example: Display setup [}156]
● 8.2.1 Type and option [}87]
● 8 Display setup menu 2 [}85]
Measurement display after system start
The following figures show example selections for the measure-
ment display after system start [}204].
 Loading...