32
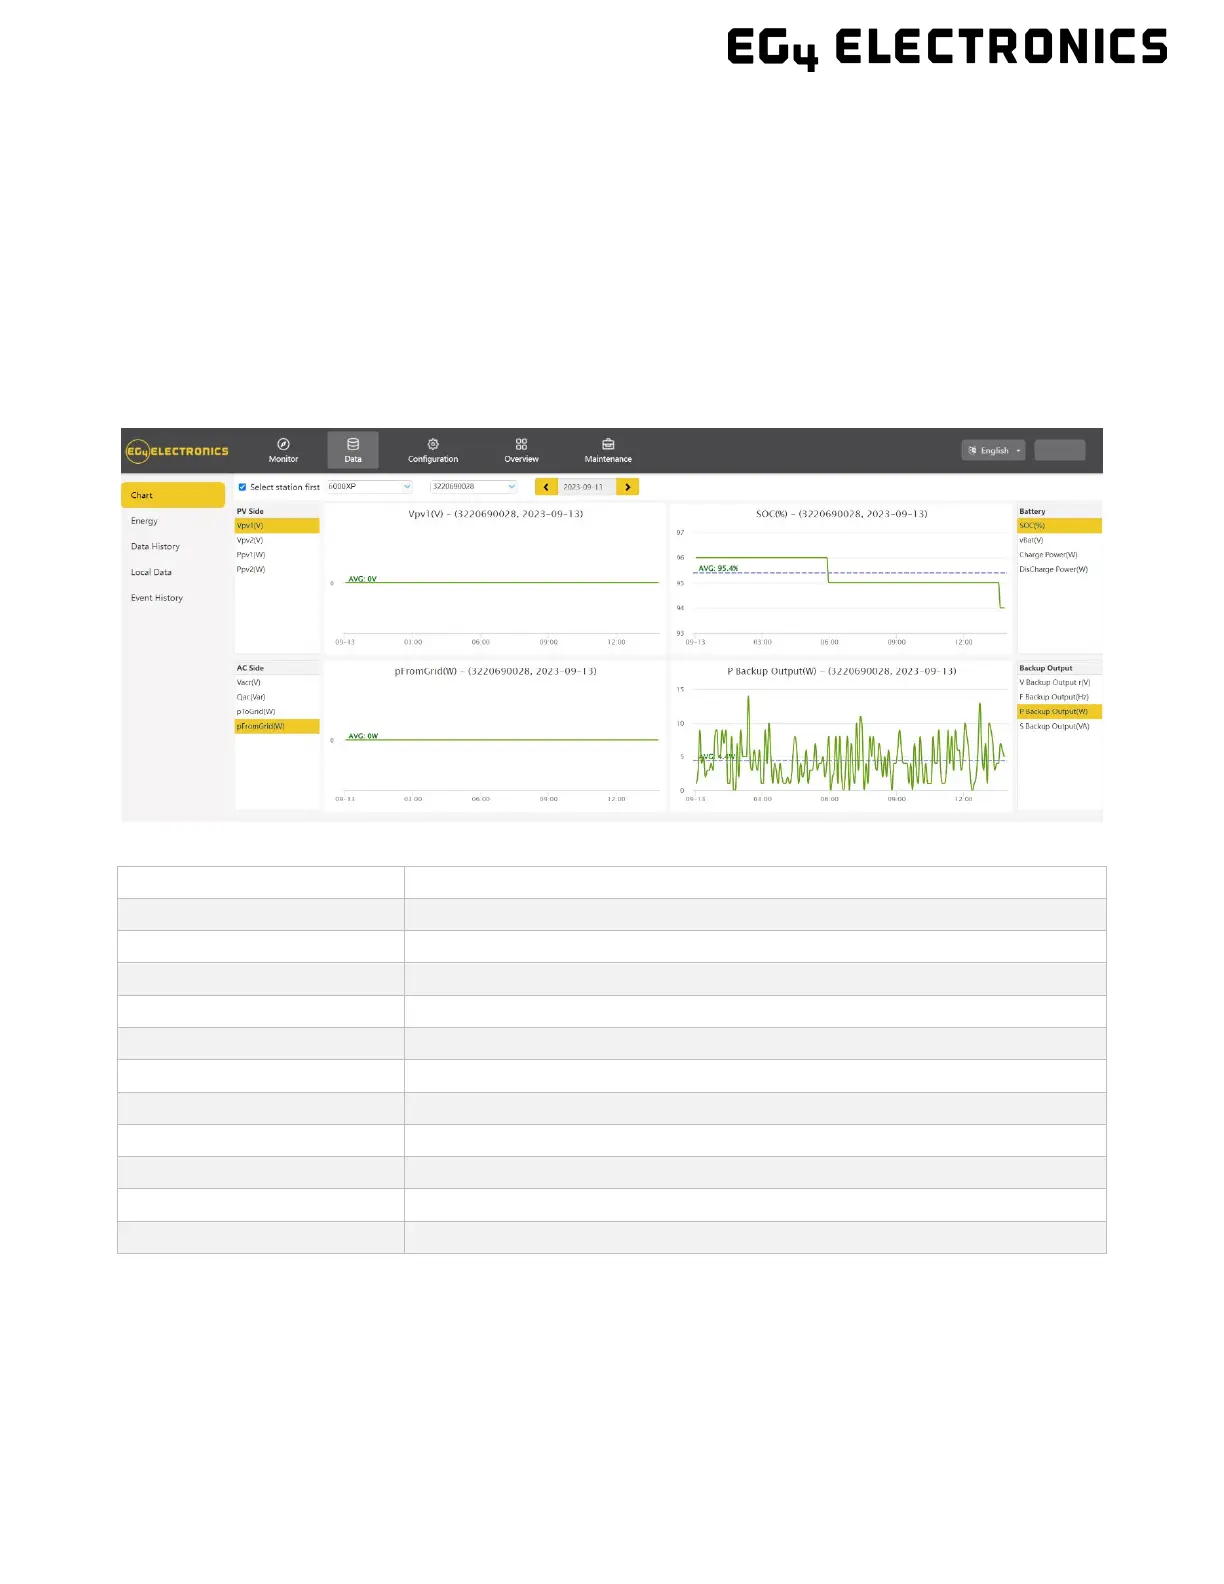
8.3.2 DASHBOARD (DATA TAB)
The Data Tab displays additional detailed data including technical details for PV, battery,
grid, and loads, that is helpful for analysis and maintenance.
Five categories make up the Data Tab view: "Chart", "Energy", "Data History", "Local data", and
"Event History." For more details on each category, please see the following tables.
Chart
Displays various parameters in chart format over a 24-hour period. There are separate
charts for “PV Si de”, “Battery”, “AC Side” and “Backup Output”.
Vpv 1-2 (V)
Voltage of solar input
Ppv 1-2 (V)
Power of solar input
SOC (%)
Battery state of charge
Battery discharging power
Power feed from grid to inverter
V Backup Output r (V)
Load rated voltage
F Backup Output (Hz)