142 EZMotion User/Programming Guide
www.controltechniques.com Revision: A8
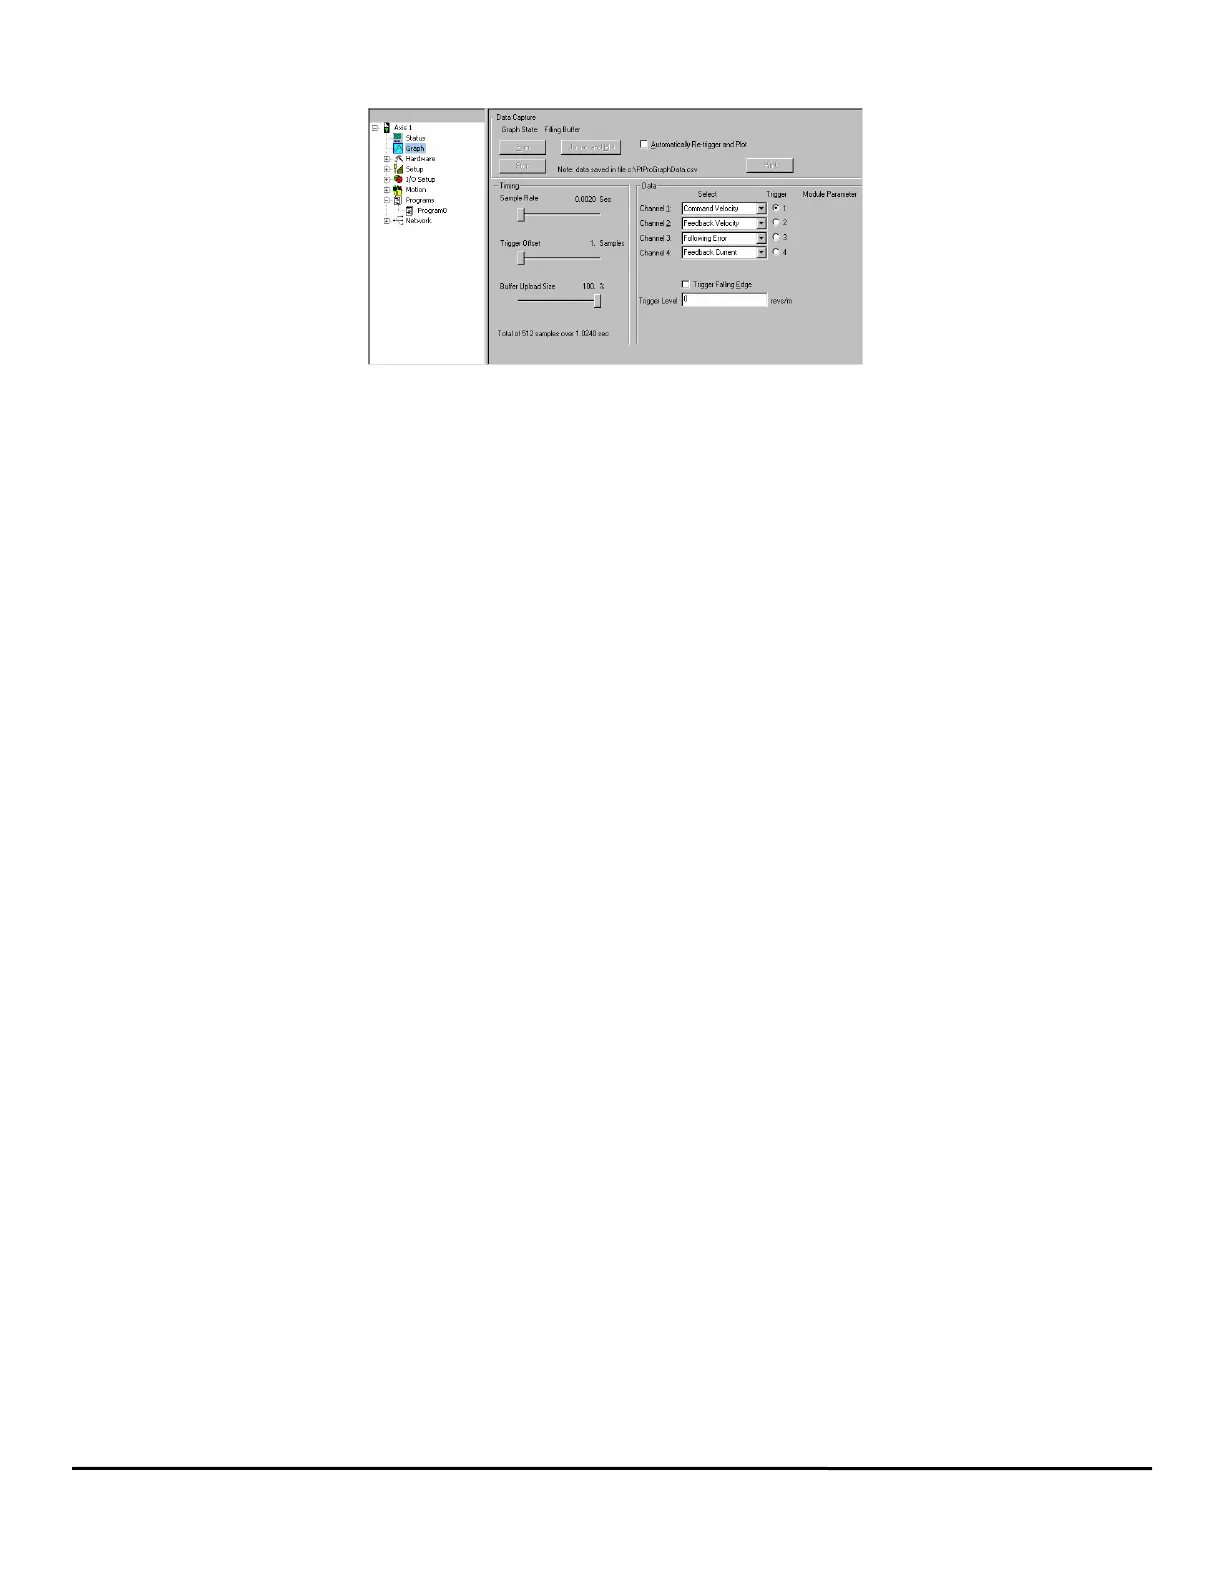
8.10 Graph View
Figure 149: Graph View - Online
8.10.1 Data Capture Group
Graph State
There are three graph state conditions in the following order: Filling Buffer, Filled. Waiting for Trigger, and Filled and Triggered.
Run
The Run button commands the drive to begin a high speed data capture of the parameters as selected in each of the four data
channels. After the Run button is activated the buffer will fill up to the trigger offset while the words “Filling Buffer” appear indicating
this graph state. Once the trigger offset level is reached the words “Waiting Trigger” will appear next to the Graph State indicating
that graphical monitor is now ready to be triggered based on the trigger level selected. The Run button may be activated by the letter
“R” on the keyboard.
Upload and Plot
The Upload and Plot button will upload captured data from the drive and display this data in the Graph window. The user should
wait for the Graph State to read “Filled and Triggered” before the data is uploaded.
Stop
The Stop button stops the data capture with the data captured at that point. You can upload and plot that data. If the buffer is only
partially filled you will get a combination of good and bad data. Stop works well as a manual trigger, in place of the configured trigger.
Automatically Re-trigger and Plot Check Box
Select the check box and the Automatically Re-trigger and Plot tells PowerTools to monitor the graph state for the triggered
condition. When this condition occurs, it automatically initiates the UploadPlot command, waits for a brief time then initiates the Run
button to repeat the cycle. Initial the user must press the Run button to start the auto cycle.
This mechanism is only active when the graph view is displayed, If the user enters a different PowerTools view the auto update will
stop and it will restart when returning to the Graph view.
Print
The Print button is used to print the graph in the Graph window.
8.10.2 Timing Group
The sliders can be moved in several different ways.
1. With the mouse pointer over the slider, left click and hold while dragging the slider back or forth to the desire setting.
2. With the mouse pointer over the slider, left click on the slider and then the arrow keys on the PC keyboard can be used to move
the slider in fine increments. The Page Up and Page Down keys move the slider in course increments. The Home key will move the
slider all the way to the left and the End key will all the way to the right.
Sample Rate
The Sample Rate slider gives the user control of time spacing for the captured data. To give the user a better idea of what this
number means, the total number of samples and total capture time is displayed on the bottom of the “Timing” group box.
Trigger Offset
The Trigger Offset slider allows the user to adjust the amount of data to be captured prior to and after the actual trigger point. It is
often desirable to see what is happening to the system just before the trigger event activates. If the Trigger Offset slider is completely
to the left (minimum # of samples), then the data captured and shown in the graph will all be AFTER the trigger point. If the slider is
positioned completely to the right (maximum # of samples), then the data captured and shown in the graph will all be BEFORE the
trigger point.
Buffer Upload Size
The Buffer Upload Size slider allows the user to adjust the amount of data to be uploaded when the Upload and Plot button is
pressed. The system always captures all 512 samples regardless of this setting. By moving the slider to the left of the default 100%
position, the upload and plot will take less time because less data is being uploaded. If the slider is completely to the right (default),
the full captured buffer will be uploaded and displayed. If the slider is completely to the left, only 1% of the captured buffer will be
uploaded and displayed.