Characteristics
2.3 Function Specifications
2
2-5
PF............................................................................................................. 0.00 to 1.00
± 0.04
Frequency range ......................................................................... 10.0 Hz to 15.0 kHz
40.0 to 70.0 Hz ...................................................................... ±(0.5 % + 2 counts)
Harmonics
Number of harmonics ................................................................DC..21, DC..33, DC..51
Readings / Cursor readings
Vrms....fund. ±(3 % + 2 counts) ..... 31
st
±(5 % + 3 counts)..... 51
st
±(15 % + 5 counts)
Irms......fund. ±(3 % + 2 counts) ..... 31
st
±(5 % + 3 counts)..... 51
st
±(15 % + 5 counts)
Watt.....fund. ±(5 % + 10 counts) ... 31
st
±(10 % + 10 counts) 51
st
±(30 % + 5 counts)
Frequency of fundamental.......................................................................... ± 0.25 Hz
Phase........................................................................................fund. ±3° ... 51
st
± 15°
K-factor (in Amp and Watt) ............................................................................± 10 %
Sags & Swells
Recording times (selectable) .............................. 4 minutes to 8 days, endless (16 days)
Readings / Cursor Readings
Vrms actual, Arms actual (cycle by cycle calculation) ............... ±(2 % + 10 counts)
Vrms max, Arms max (idem at cursor) ....................................... ±(2 % + 12 counts)
Vrms average, Arms average (only at cursor)............................. ±(2 % + 10 counts)
Vrms min, Arms min (idem at cursor) ........................................ ±(2 % + 12 counts)
Transients
Detection of voltage transients ............................................................................ > 40 ns
Useful input bandwidth input 1 (with test leads TL24)..............................DC to 1 MHz
Reference signal ............................................................................................... Vrms, Hz
After START, the Vrms and frequency of the signal are measured.
From these data a pure sine wave is calculated.
Detection when transients exceed specified voltage level (selectable)
Voltage levels ................................... 20 %, 50 %, 100 %, 200 % of reference signal
Number of transient memories (temporary) ................................................................ 40
Cursor reading
Vpeak min, Vpeak max at cursor ..................................................± 5 % of full scale
Inrush
Graphic display
Current ranges (selectable).................. 1 A, 5 A, 10 A, 50 A, 100 A, 500 A, 1000 A
Inrush times (selectable)........................................... 1 s, 5 s, 10 s, 50 s, 100 s, 5 min
Cursor readings
A peak max at cursor 1..................................................................± 5 % of full scale
A peak max at cursor 2..................................................................± 5 % of full scale
Time between cursors.................................................................. ±(0.2 % + 2 pixels)
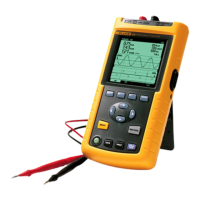
2.3.2 Scope
Input Impedance
Input 1............................................ 1 MΩ // 12 pF (± 2 pF). With BB120: 20 pF ± 3 pF
Input 2............................................ 1 MΩ // 10 pF (± 2 pF). With BB120: 18 pF ± 3 pF
Horizontal
Time base modes (selectable)......................................................... Normal, Single, Roll
Ranges (selectable within modes)
In Normal............................................................................................ 5 s to 20 ns/div
In Single shot........................................................................................5 s to 1 µs/div
In Roll mode .........................................................................................60 s to 1 s/div
Time base error................................................................................< ±(0.4 % + 1 pixel)

 Loading...