AirCheck Wi-Fi Tester
Users Manual
44
Change the Thresholds for the Colors in Bar
Graphs
The bar graphs show you if the signal strength, noise, Signal
to Noise Ratio (SNR), etc. are above or below specified
thresholds. They are represented as red, yellow, or green.
You can change the thresholds to meet the requirements of
your network.
To change thresholds
1
Select Tools.
2
Select Thresholds / AutoTest Settings.
3
Select an item. Figure 12 shows how to change the
thresholds for the colors.
Note
In AutoTest, results that are green or better pass, results
that are red and below fail, and results in between red and
green produce a warning.
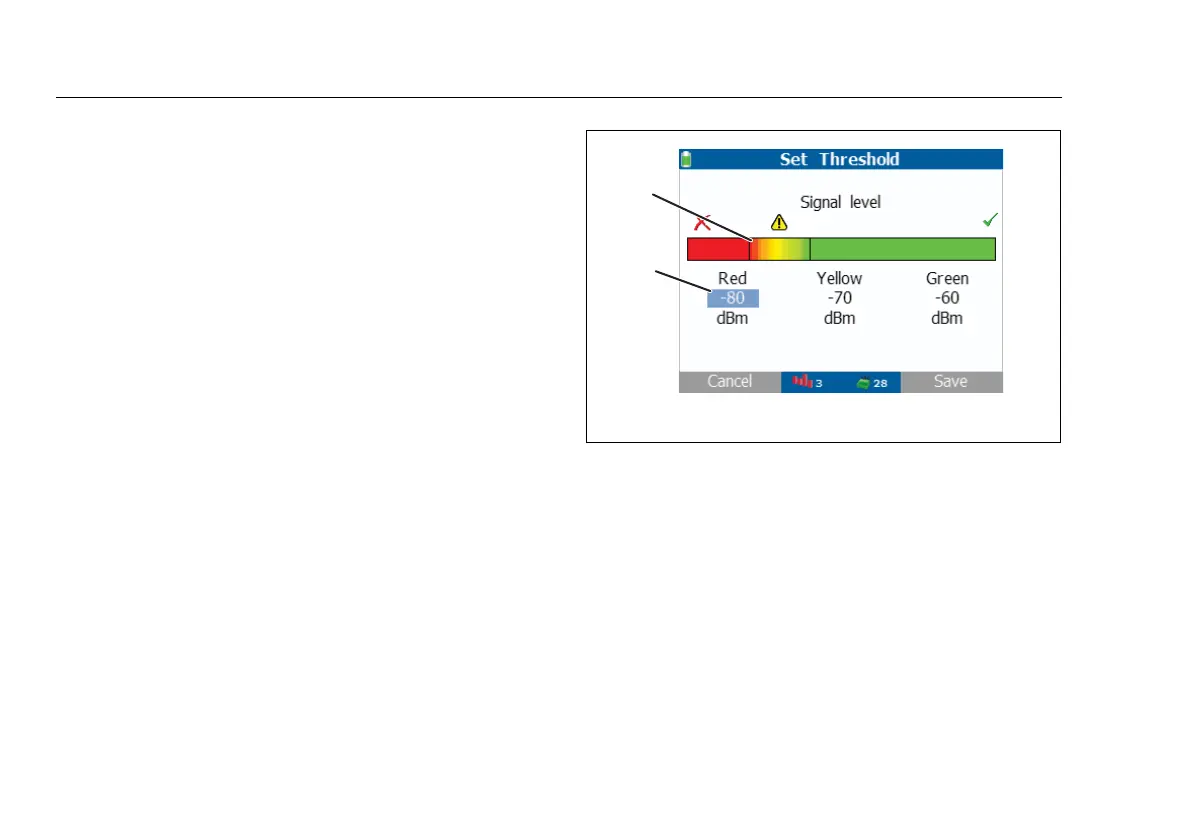
ffy05.eps
Figure 12. Change the Thresholds for the Colors in a Bar
Graph
Use to select a color. Use to increase or
decrease the measured value for the color.
The vertical lines show where the value you set is on the
bar graph.
To save your settings, press Save. To exit and not
save your settings, press Cancel.
B
CCC