Chapter 1 DaqPRO 19
• When opening a stored recording.
The graphic display is available for recordings with up to 4 sensors simultaneously.
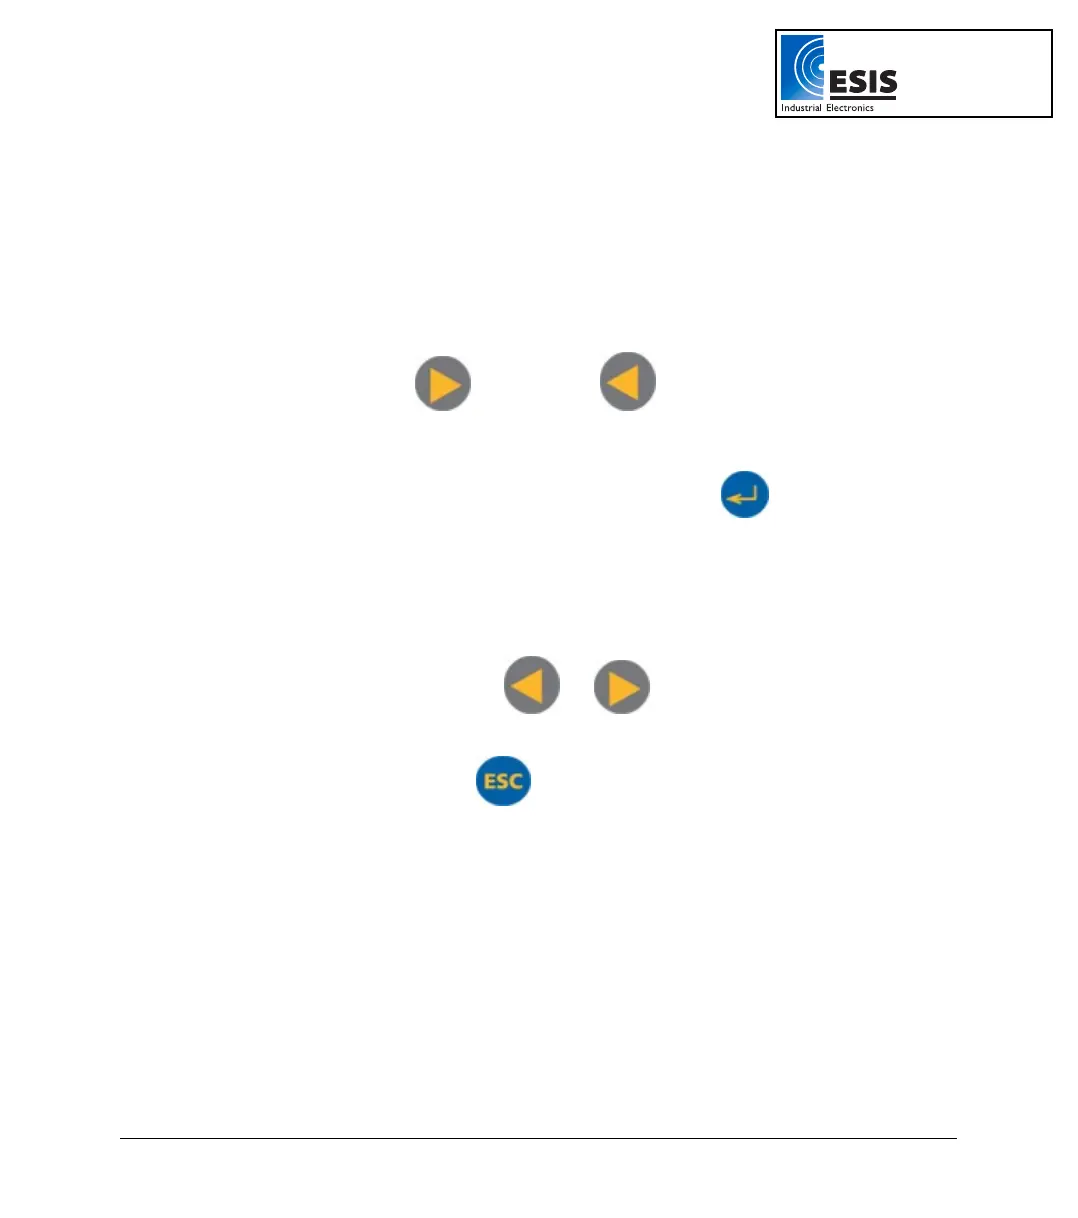
1. The Cursor
Use the Cursor in Graphic Display mode to read data values or to zoom in to the area around a
selected point. The cursor is displayed automatically after logging has ended, or when opening a stored
recording.
a. Use the Forward
and Backward arrow buttons to move the cursor.
DaqPRO displays the point coordinates at the bottom of the graph.
b. If there is more than one sensor, press the Enter button
to move the cursor
to another plot on the graph.
2. Zooming
a. Position the cursor in the area you want to zoom into.
b. Press the two arrow buttons,
and , simultaneously. You will zoom in
around the cursor in a 2:1 ratio.
c. Press the Escape button
to zoom out.
www.esis.com.au
Ph 02 9481 7420
Fax 02 9481 7267
esis.enq@esis.com.au