52 Chapter 2 Working with DaqLab
b. Select the graph you wish to modify.
c. Select the measurement you wish to display on the X-axis.
d. If you want a specific scale, uncheck the Auto scale check box and enter the
minimum and maximum values of the axis.
e. Click OK.
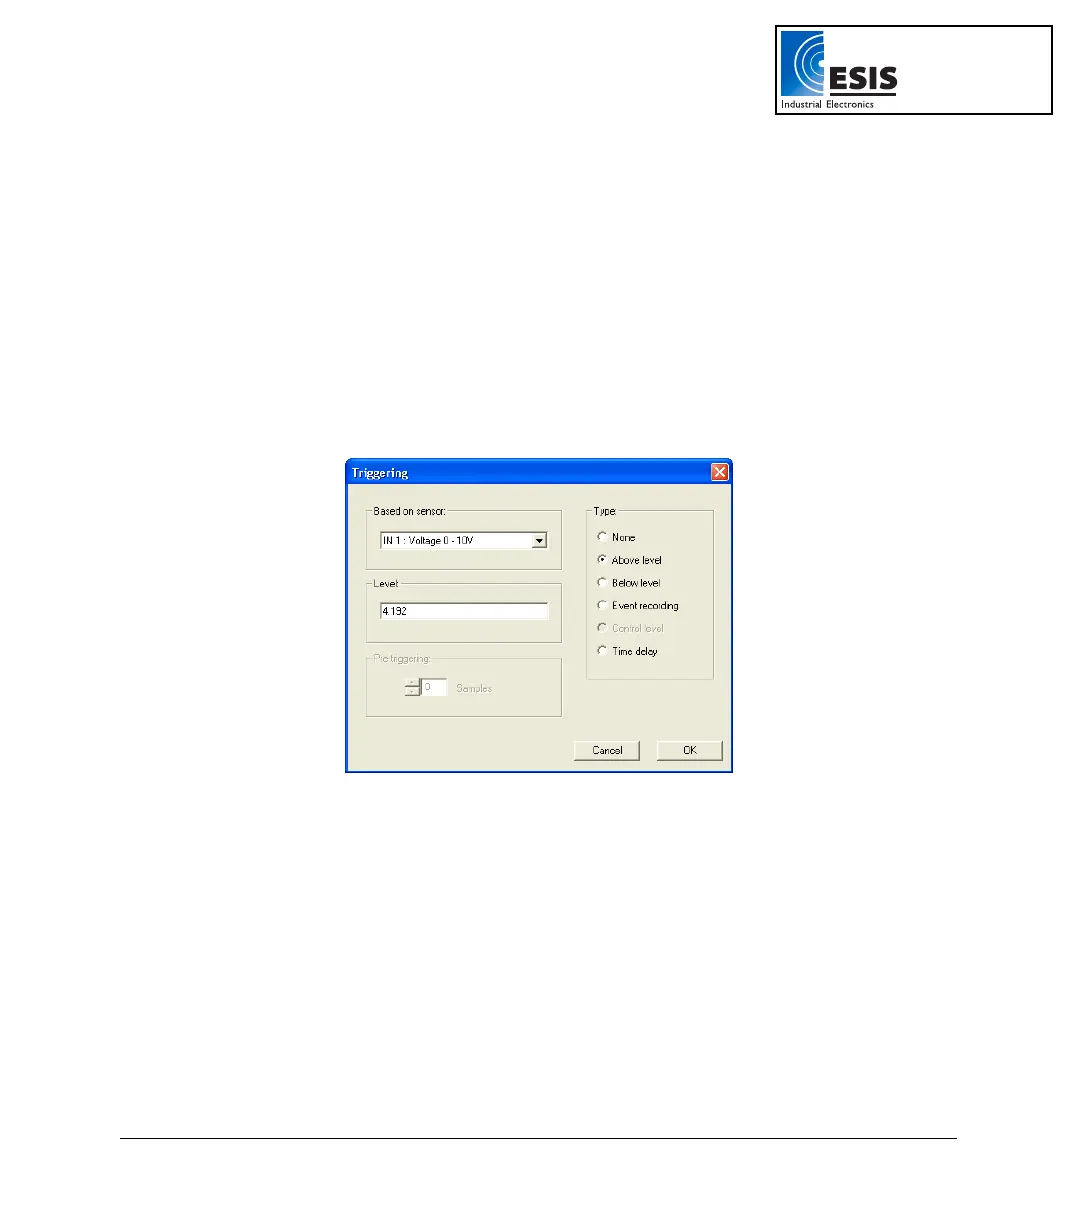
8. Triggering
To start the data recording only when a specific time or measurement condition has been met, click
Triggering in step 3 of the Setup wizard to open the triggering dialog:
Figure 15: Triggering dialog box
Select the triggering sensor in the Based on sensor text box.
Choose one of the following from the Type options:
• None – Trigger is disabled.
• Above level – Start logging only once the measured value is Higher than the
trigger level.
• Below level – Start logging only once the measured value is Lower than the
trigger level.
• Event Recording – This function enables you to record the exact time and
date at which a certain phenomenon occurred: The trigger level set for this
www.esis.com.au
Ph 02 9481 7420
Fax 02 9481 7267
esis.enq@esis.com.au