70 Chapter 2 Working with DaqLab
2. Curve Fit
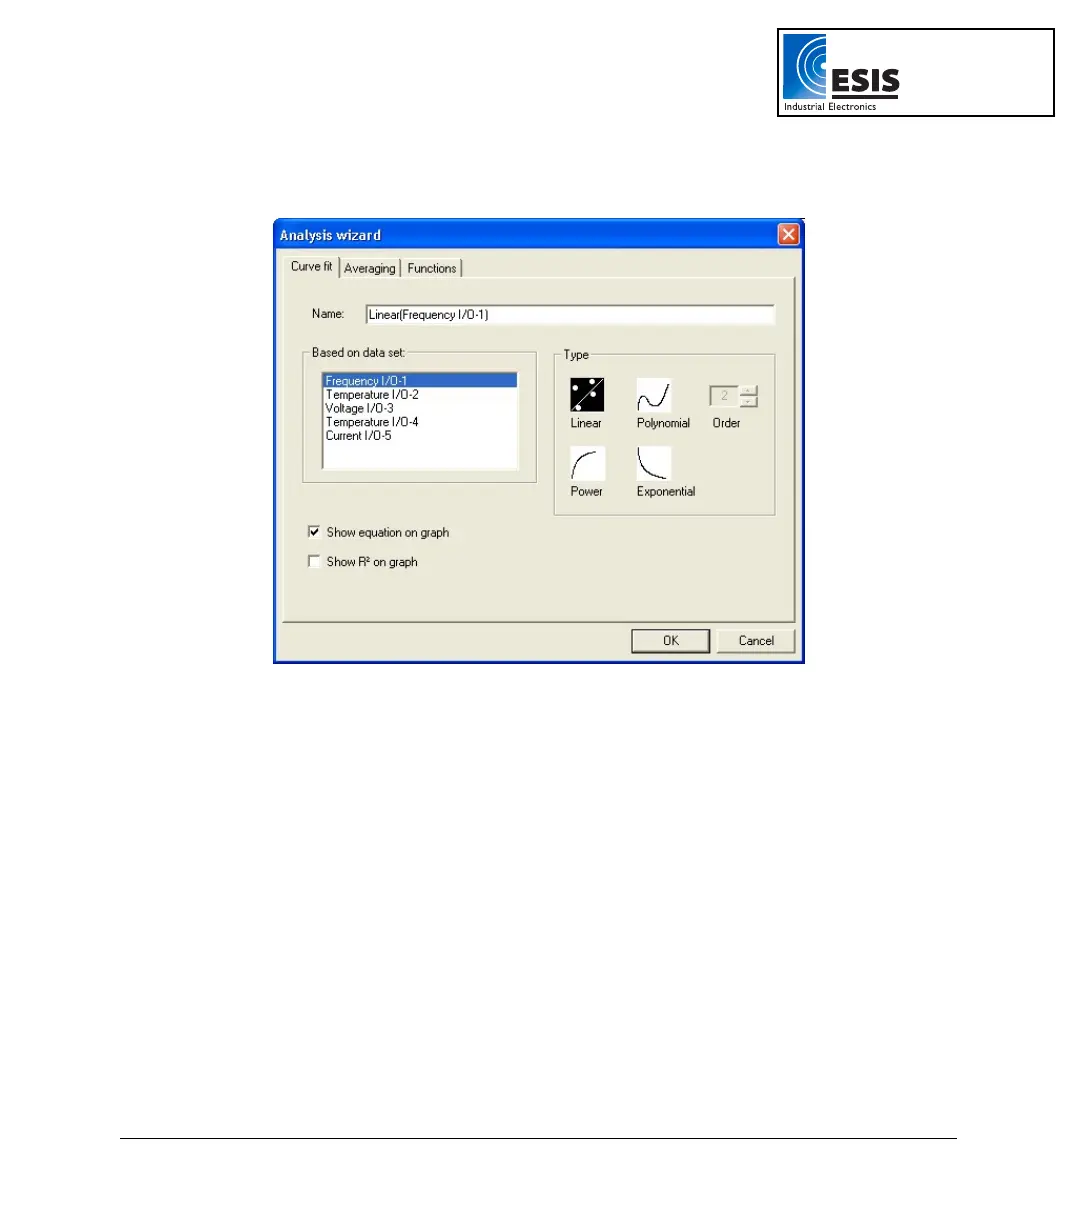
Figure 24: Analysis wizard – Curve fit
a. Select a fit Type by clicking its icon (if you choose polynomial fit, select the order
you want).
b. If you use the cursor to select a data set, it will be highlighted in the Based on
data set list, but you have the option of selecting a different data set.
c. Type a name in the Name box (optional - the default name includes both the
function and the data set names).
d. Click the Show equation on graph check box to display the line’s equation on the
information bar.
e. Click the Show R2 on graph check box to display the correlation coefficient on the
information bar.
f. Click OK.
www.esis.com.au
Ph 02 9481 7420
Fax 02 9481 7267
esis.enq@esis.com.au